Amazon Brand Story Examples
We have 1,177 brand story examples from 20 Amazon listings, 1% of the library. Health & Household has the most (32%, 2.1× its share of the library).
- Examples
- 1,177
- Listings
- 20
- Share of library
- 1%
- Top categories
- Health & Household, Grocery & Gourmet Food and Beauty & Personal Care
The best brand story examples
Ranked by a score built from what the image does at a glance: how big and how readable its message is, measured, plus a design judgement. 1,176 images in this collection are scored.
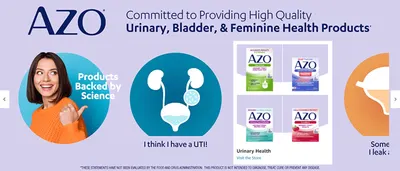
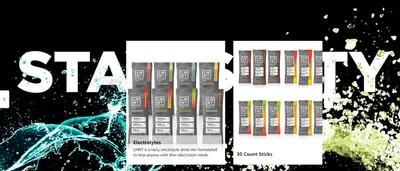 B084HQ4DYQ95Reads at a glance
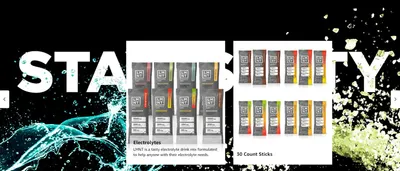 B084HQ4DYQ93Reads at a glance
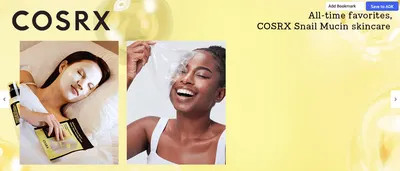 Amazon.com: COSRX Snail Mucin 96% Power Repairing Essence 3.38 fl.oz 100ml85Reads at a glance
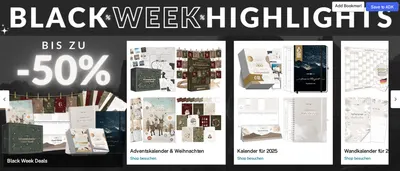 Amazon.de: LEBENSKOMPASS Träumerle Board für Kinder85Reads at a glance
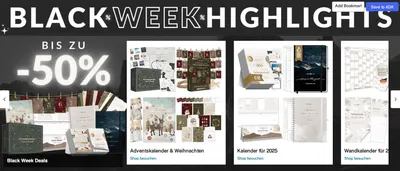 Amazon.de: LEBENSKOMPASS Träumerle Board für Kinder85Reads at a glance
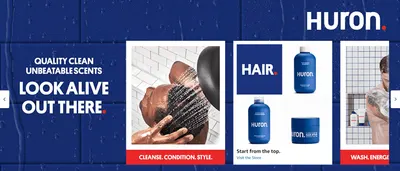 B083XHKMNH82Reads at a glance
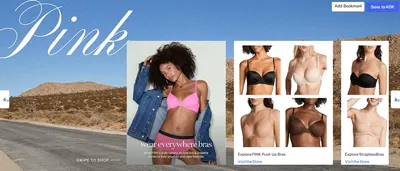 Victoria's Secret Women's Pink Wear Everywhere Lightly Lined T-Shirt Bra81Reads at a glance
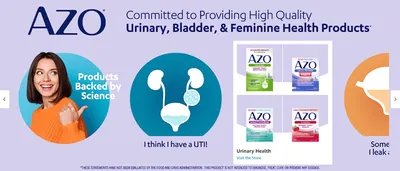 B001E8ISJW80Readable
 B0012JY42I80Readable
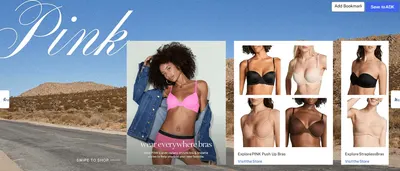 Victoria's Secret Women's Pink Wear Everywhere Lightly Lined T-Shirt Bra79Readable
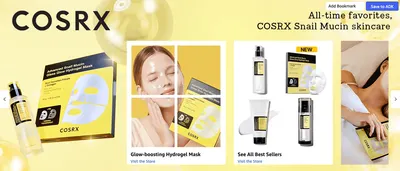 Amazon.com: COSRX Snail Mucin 92% Face Moisturizer78Readable
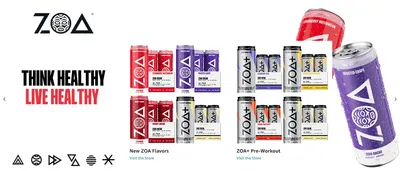 B08PDNJTD878Readable
| Measured | Best 7 | The rest | Accessibility floor |
|---|---|---|---|
| Headline height, % of image | 22.2% | 8.5% | 6.5% on a search tile |
| Headline contrast | Lc 95 | Lc 67 | Lc 45 minimum, 60 preferred |
| Text area, % of image | 11.9% | 11.0% | — |
| Separate blocks of text | 6 | 17 | — |
| Headline set bold | 29% | 30% | — |
| Still readable blurred to tile size | 100% | 5% | — |
Measured on 1,104 images with OCR: text height as a share of the image, APCA contrast against what sits behind the text, and whether the headline can still be read once the image is blurred to the size a shopper sees in search.
Every example
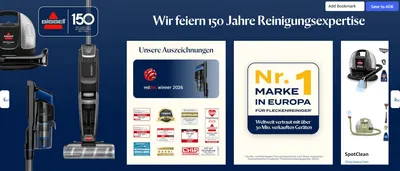 Amazon.de: BISSELL SpotClean HydroSteam Teppichreiniger & Dampfreiniger 1000W 3689N
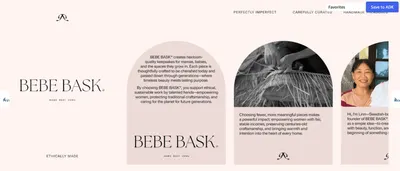 Amazon.com: BEBE BASK Premium Baby Diaper Caddy Organizer
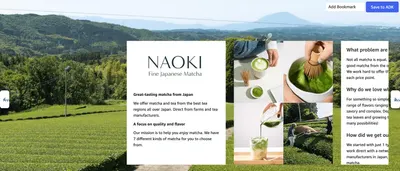 Amazon.com: Naoki Matcha Superior Ceremonial Blend
 Amazon.com: Rael 100% Organic Cotton Menstrual Regular Pads
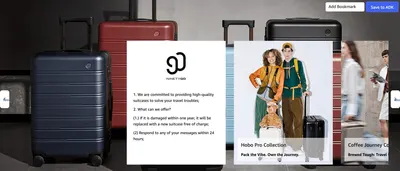 Amazon.com
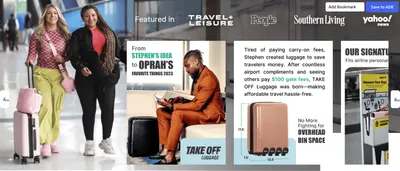 Amazon.com
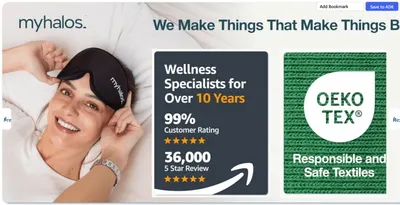 MyHalos® 100% Blackout Sleep Masks for Women & Men
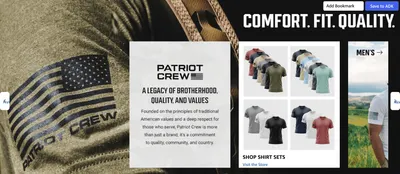 Amazon.com: Patriot Crew Men's Fresh T-Shirt
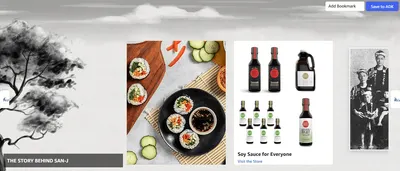 Amazon.com : San-J
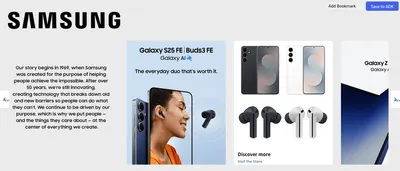 Amazon.com: SAMSUNG Galaxy S25 Ultra
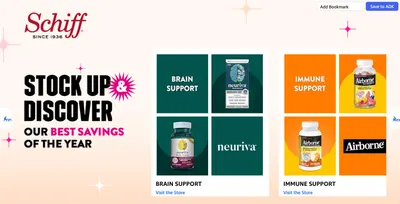 Amazon.com: NEURIVA Ultra Decaffeinated Clinically Tested Nootropic Brain Supplement for…
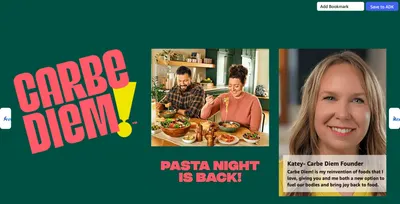 Amazon.com : Carbe Diem!
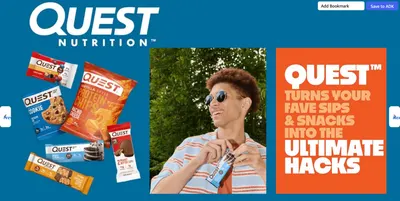 Amazon.com: Quest Nutrition Ultimate Variety Pack Protein Bars
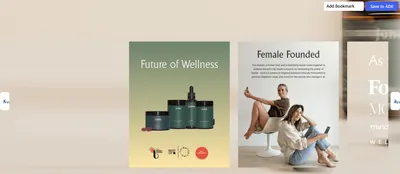 Amazon.com: Juna Detox Digestive Enzymes & Probiotic
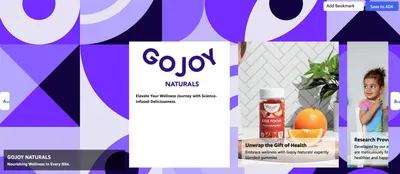 Amazon.com: GOJOY 7-in-1 Sugar-Free NAC Gummies
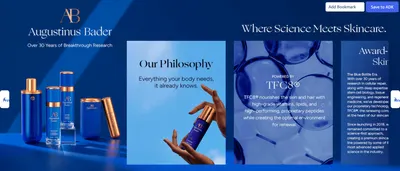 Amazon.com: Augustinus Bader The Rich Cream
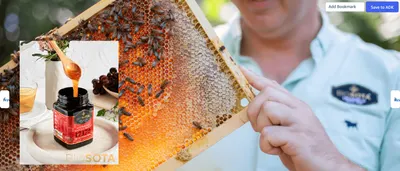 Amazon.com : BIOSOTA Organic Manuka Honey MGO 1717+
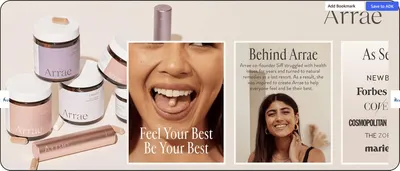 Amazon.com: Arrae MB-1
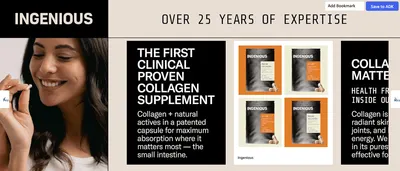 INGENIOUS 100% Pure Marine Collagen Capsules
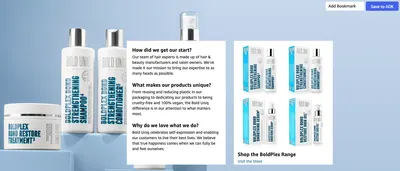 Amazon.com: BoldPlex Hair Mask
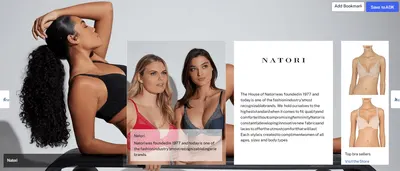 Natori Women's Pure Luxe Custom Coverage Contour
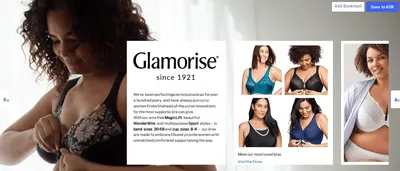 Full Figure Plus Size Wonderwire Front-Closure Stretch Lace Bra Underwire #9245 Black at…
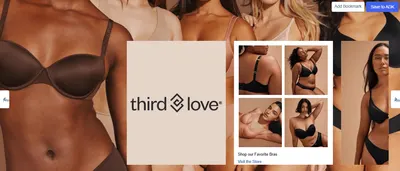 ThirdLove Classic T Shirt Bra
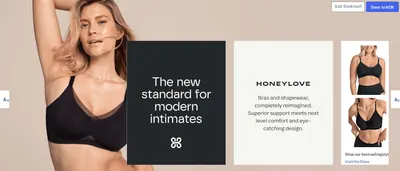 HONEYLOVE Bras for Women
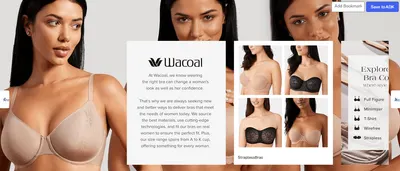 Wacoal Women's Simone Unlined Full Coverage Underwire Sports Bra
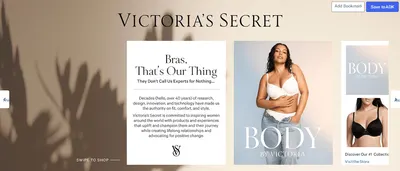 Victoria's Secret Women's VSX Featherweight Max Front Close Sports Bra
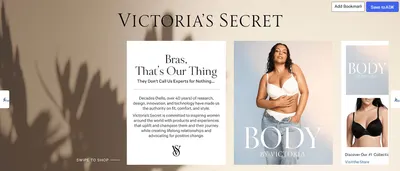 Victoria's Secret Women's Very Sexy Bombshell Adds-2-Cups Push Up Bra
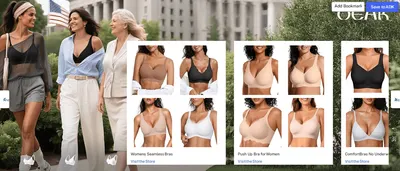 OEAK Womens Deep V Bras Wireless Comfortable Bra Supportive No Underwire Bras Tshirt…Victoria's Secret Women's Pink Wear Everywhere Lightly Lined T-Shirt BraVictoria's Secret Women's Pink Wear Everywhere Lightly Lined T-Shirt Bra
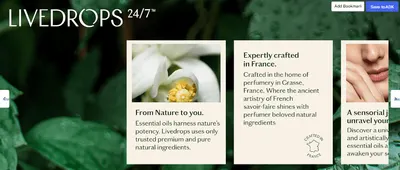 Amazon.com: LIVEDROPS 24/7 Sleep Good Essential Oil Blend
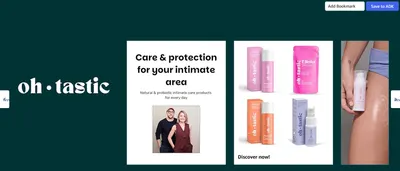 Natural Sensitive Lubricant with Hyaluronic Acid for Women
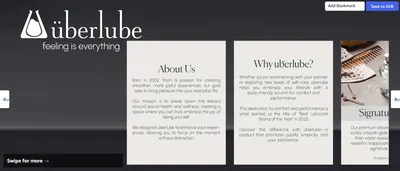 Überlube Luxury Lubricant
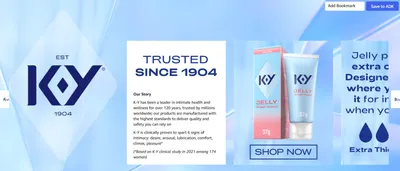 KY Jelly Lube
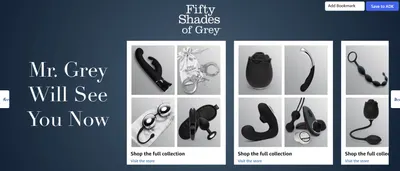 Fifty Shades of Grey at Ease Water Based Lube Gel
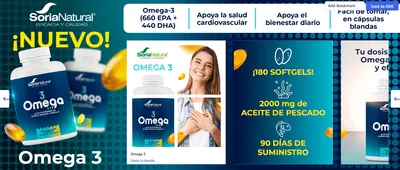 Soria Natural Ginkgo Biloba Extracto
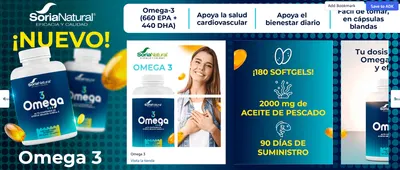 Soria Natural Ginkgo Biloba Extracto
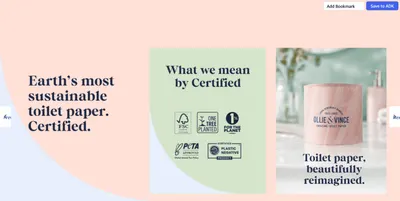 Amazon.com: Ollie & Vince Bamboo Toilet Paper
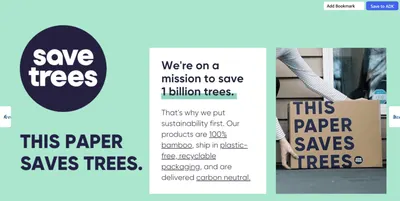 Amazon.com: Save Trees Bamboo Facial Tissues
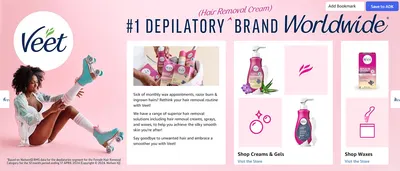 Amazon.com : Hair Remover
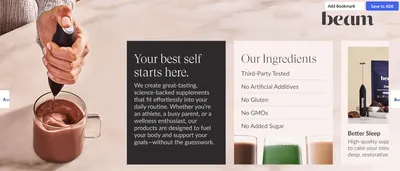 Amazon.com: Beam Creatine Monohydrate Powder
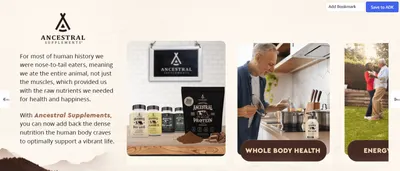 Amazon.com: Ancestral Supplements Mofo
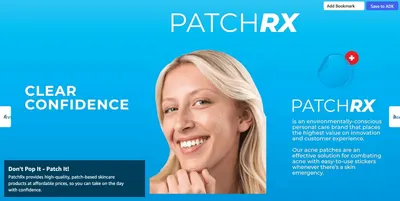 Amazon.com: PatchRx Pimple Patches for Face (120 Patches)
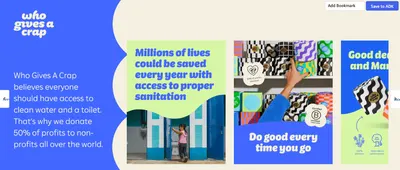 Amazon.com: Who Gives A Crap 100% Bamboo Toilet Paper
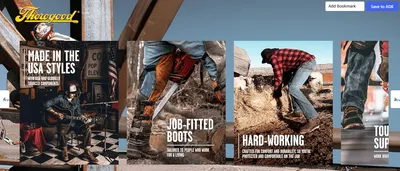 Amazon.com
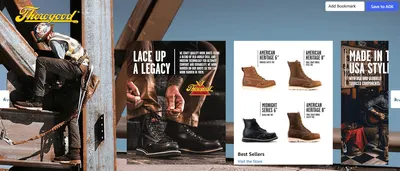 Amazon.com
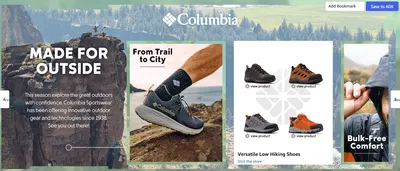 Columbia Men's Hiking Shoes
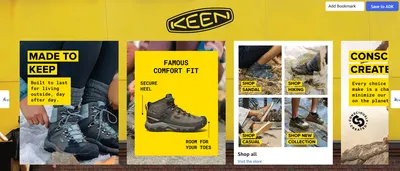 KEEN Men's Newport H2 Sandal
Categories that use brand story most
| Category | Examples | Share | vs library |
|---|---|---|---|
| Health & Household | 372 | 32% | 2.1× |
| Grocery & Gourmet Food | 107 | 9% | 0.7× |
| Beauty & Personal Care | 97 | 8% | 1.0× |
| Baby Products | 91 | 8% | 2.4× |
| Home & Kitchen | 89 | 8% | 0.7× |
| Pet Supplies | 65 | 6% | 1.2× |
| Clothing, Shoes & Jewelry | 48 | 4% | 1.0× |
| Patio, Lawn & Garden | 30 | 3% | 0.9× |
| Toys & Games | 30 | 3% | 0.9× |
| Office Products | 22 | 2% | 0.6× |
Brand Story by category
- Health & Household372
- Grocery & Gourmet Food107
- Beauty & Personal Care97
- Baby Products91
- Home & Kitchen89
- Pet Supplies65
- Clothing, Shoes & Jewelry48
- Patio, Lawn & Garden30
- Toys & Games30
- Office Products22
Related image types
- Secondary Images52,104
- Main Images9,299
- Premium A+ Modules5,758
- Premium A+ Content2,838
- Basic A+ Content2,410
- Brand Store1,138
- Sponsored Brands Ads555
- A+ Modules324
- Product Videos79
Brands using brand story
Our design team makes Amazon listing images, infographics and A+ content. £750 per day, with revisions the next day.
Last example added 2026-08-12 · 1,177 examples. Image types are tagged by AI and checked by hand in samples.