Amazon UGC A+ Module Examples
We have 53 UGC A+ module examples from 50 Amazon listings, under 1% of the library. Beauty & Personal Care has the most (21%, 2.5× its share of the library). Common themes: Customer Photo Grid, Customer Photos and Social Proof.
- Examples
- 53
- Listings
- 50
- Share of library
- under 1%
- Top categories
- Beauty & Personal Care, Clothing, Shoes & Jewelry and Grocery & Gourmet Food
The best UGC A+ module examples
Ranked by a score built from what the image does at a glance: how big and how readable its message is, measured, plus a design judgement. 47 images in this collection are scored.
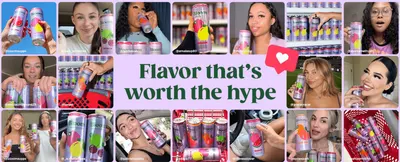 Bloom Nutrition Sparkling Energy Drink70Readable
 Eomenie Women's One Piece Swimsuits Tummy Control Cutout High Waisted Bathing Suit Wrap…70Readable
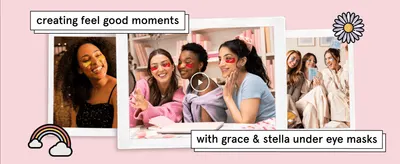 grace & stella Award Winning Under Eye Mask70Readable
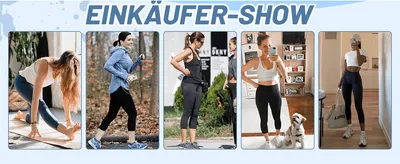 TNNZEET 3er Pack Capri Leggings Damen 3/4 für Sport70Readable
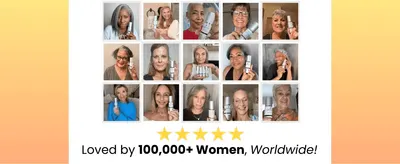 Vibriance Super C Serum for Mature Skin70Readable
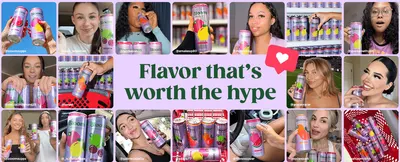 Bloom Nutrition Sparkling Energy Drink70Readable
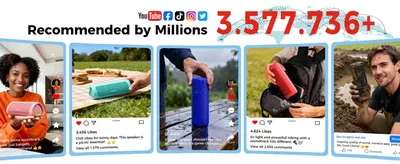 Bluetooth Speaker69Readable
 Berberine Supplement 1500mg67Readable
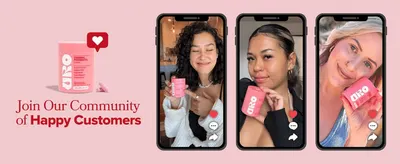 URO Vaginal Probiotics for Women pH Balance with Prebiotics & Lactobacillus Probiotic…67Readable
| Measured | Best 5 | The rest | Accessibility floor |
|---|---|---|---|
| Headline height, % of image | 7.3% | 7.3% | 6.5% on a search tile |
| Headline contrast | Lc 101 | Lc 54 | Lc 45 minimum, 60 preferred |
| Text area, % of image | 6.2% | 10.9% | — |
| Separate blocks of text | 2 | 8 | — |
| Headline set bold | 0% | 50% | — |
| Still readable blurred to tile size | 0% | 8% | — |
Measured on 45 images with OCR: text height as a share of the image, APCA contrast against what sits behind the text, and whether the headline can still be read once the image is blurred to the size a shopper sees in search.
Every example
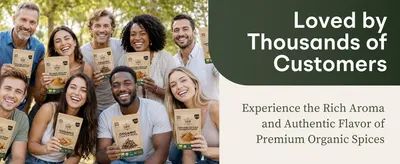 Organic Ceylon Cinnamon Powder
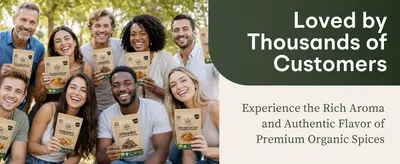 Organic Ceylon Cinnamon Powder
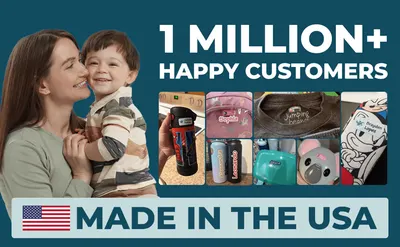 Personalized Name Labels for Kids (70 Labels)
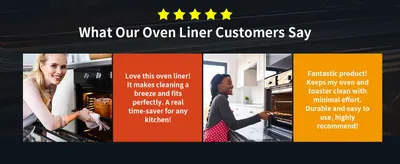 3 Pack Oven Liners for Bottom of Oven
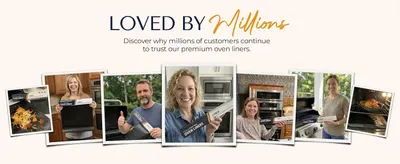 Oven Liners for Bottom of Oven
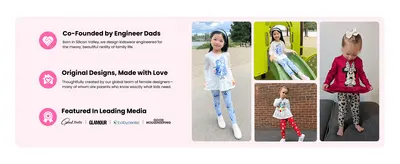 Disney Toddler Girls Clothes Long Sleeve Shirt Leggings 2pcs Outfits Set
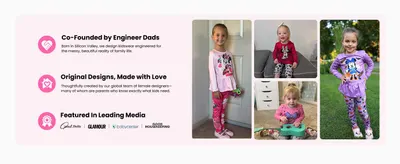 Disney Toddler Girls Clothes Long Sleeve Shirt Leggings 2pcs Outfits Set
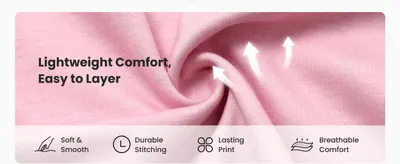 Disney Toddler Girls Clothes Long Sleeve Shirt Leggings 2pcs Outfits Set
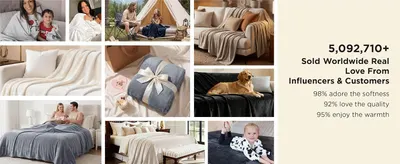 Bedsure GentleSoft Fleece Blankets Queen Size Linen Beige
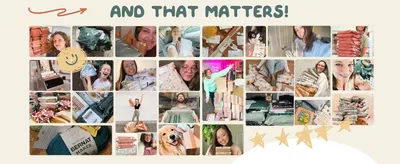 Poly Mailers 12x15.5 InchBluetooth Speaker
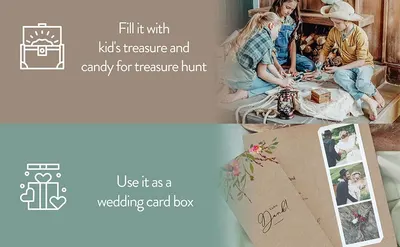 SLPR
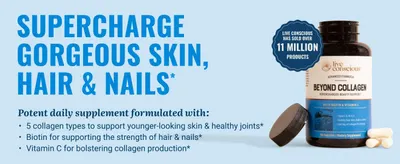 Live Conscious Beyond Collagen Multi Collagen Capsules
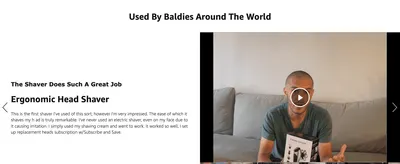 Detachable Head Shavers
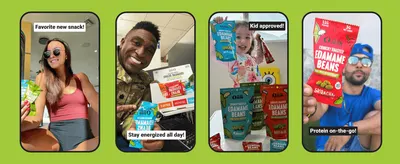 The Only Bean High Protein Snacks
 Sleep Doctor Approved Cervical Neck Pillow for SleepingBloom Nutrition Sparkling Energy Drink
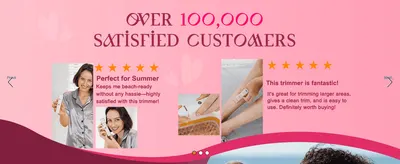 Bikini Trimmer for Women
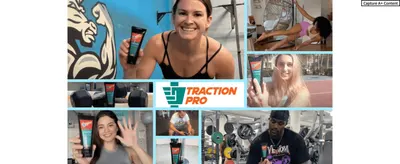 TRACTION PRO Liquid Chalk Combo 50+250ml
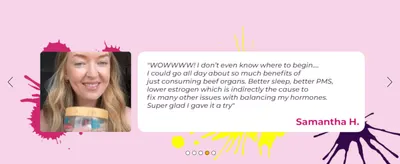 Primal Queen Female-Optimized Beef Organ Superfood Supplement (Beef Liver
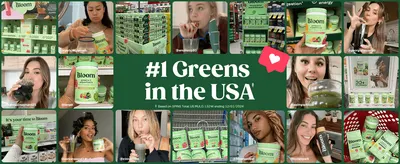 Bloom Nutrition Superfood Greens PowderEomenie Women's One Piece Swimsuits Tummy Control Cutout High Waisted Bathing Suit Wrap…
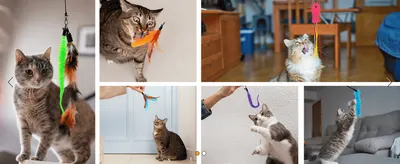 Toozey Katzenspielzeug 16 Stück
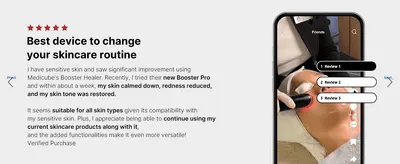 medicube Age-R Booster Pro Pink
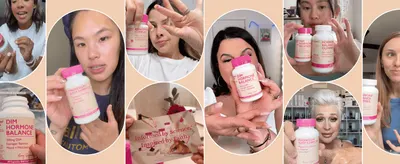 Amy Suzanne Wild Yam Cream for Hormone Balance
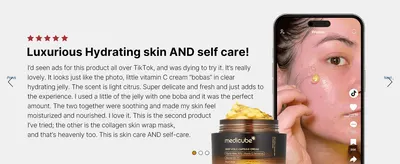 medicube Deep Vitamin C Golden Capsule Face Moisturizer
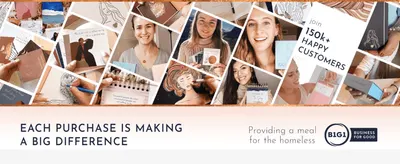 RYVE Coloring Book for Adults Relaxation
 Eomenie Women's One Piece Swimsuits Tummy Control Cutout High Waisted Bathing Suit Wrap…
 Hagon PRO Disposable Rain Ponchos for Adults (5 Pack) : Clothinggrace & stella Award Winning Under Eye Mask
 Brainista Yerba Mate Instant Tea Powder
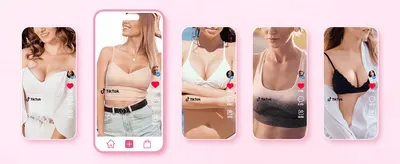 Ultra Push up Sticky Bra Pads Inserts
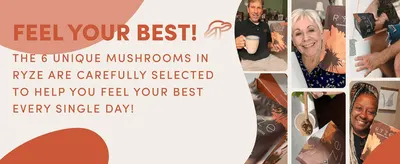 RYZE SUPERFOODS RYZE n Shine Bundle
 Yerba Mate Instant Tea PowderURO Vaginal Probiotics for Women pH Balance with Prebiotics & Lactobacillus Probiotic…
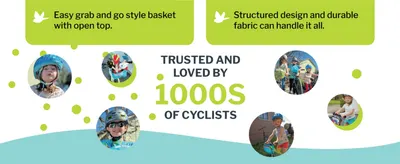 Po Campo Kids Bike BasketTNNZEET 3er Pack Capri Leggings Damen 3/4 für SportVibriance Super C Serum for Mature Skin
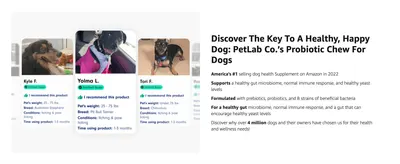 PetLab Co. Probiotics for Dogs
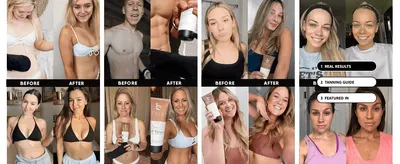 Beauty by Earth Self Tanner
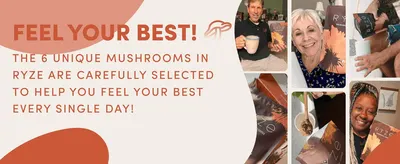 RYZE Mushroom Coffee Starter KitBerberine Supplement 1500mg
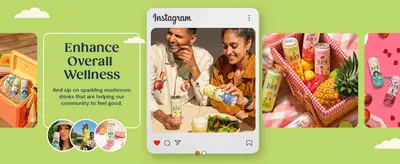 Juni Sparkling Adaptogen Drink with Ashwagandha
 GUVIVI Retro Oval Sunglasses for Women Chic Cat Eye 90s Sunnies Lightweight Narrow…Bloom Nutrition Sparkling Energy Drink
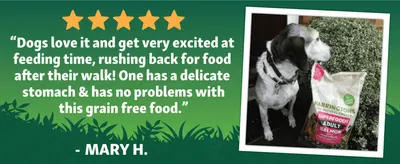 Harringtons Superfoods Complete Grain Free Hypoallergenic Salmon with Veg Dry Adult Dog…
 Lectron Level 1 EV Charger
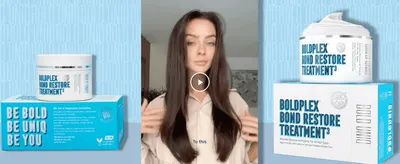 BoldPlex Hair Mask
Categories that use UGC A+ modules most
| Category | Examples | Share | vs library |
|---|---|---|---|
| Beauty & Personal Care | 11 | 21% | 2.5× |
| Clothing, Shoes & Jewelry | 10 | 19% | 4.8× |
| Grocery & Gourmet Food | 8 | 15% | 1.2× |
| Health & Household | 7 | 13% | 0.9× |
| Home & Kitchen | 3 | 6% | 0.5× |
| Pet Supplies | 3 | 6% | 1.2× |
| Office Products | 2 | 4% | 1.2× |
| Sports & Outdoors | 2 | 4% | 0.9× |
| Appliances | 1 | 2% | 2.5× |
| Books | 1 | 2% | 7.0× |
Common design themes
- Customer Photo Grid12
- Customer Photos9
- Social Proof8
- Customer Photo Collage7
- Brand Story3
- Customer Love3
- Customer Quote3
- Buyer Show2
Related image types
- Single Benefit A+ Modules2,286
- Brand A+ Modules1,722
- Infographic A+ Modules1,655
- Lifestyle A+ Modules592
- Key Stat A+ Modules499
- Product Detail A+ Modules399
- Safety / Compatibility A+ Modules387
- How to Use A+ Modules348
- Use Case A+ Modules328
- Dimension A+ Modules220
- What's in the Box A+ Modules134
- Comparison Chart A+ Modules115
Brands using UGC A+ modules
Our design team makes Amazon listing images, infographics and A+ content. £750 per day, with revisions the next day.
Last example added 2026-11-05 · 53 examples. Image types are tagged by AI and checked by hand in samples.