Amazon Comparison Chart A+ Module Examples
We have 108 comparison chart A+ module examples from 93 Amazon listings, under 1% of the library. Health & Household has the most (20%, 1.3× its share of the library). Common themes: Product Comparison, Absorption and Dust Free.
- Examples
- 108
- Listings
- 93
- Share of library
- under 1%
- Top categories
- Health & Household, Home & Kitchen and Beauty & Personal Care
The best comparison chart A+ module examples
Ranked by a score built from what the image does at a glance: how big and how readable its message is, measured, plus a design judgement. 104 images in this collection are scored.
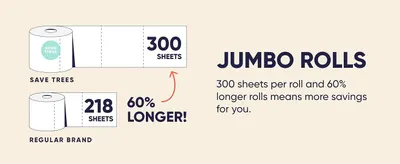 Save Trees Bamboo Toilet Paper -24 Rolls Of Septic Safe Organic Toilet Paper 3-ply84Reads at a glance
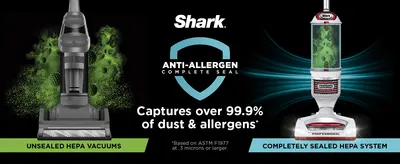 Shark NV501 Rotator Professional Lift-Away Upright Vacuum with HEPA Filter84Reads at a glance
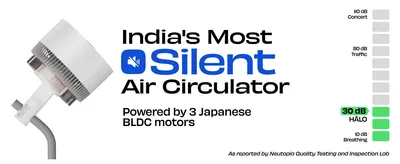 NUUK HALO v2 3D Air Circulation Tower Fan with Mood Lamp73Readable
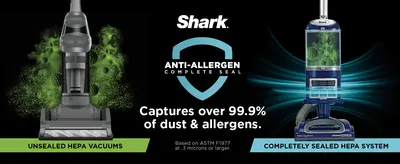 Shark Upright Vacuum72Readable
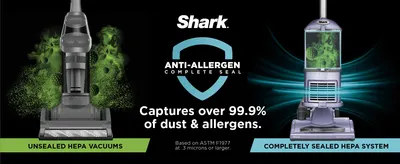 Shark NV352 Navigator Lift Away Upright Vacuum72Readable
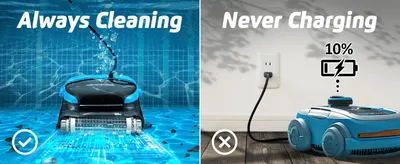 Dolphin Nautilus CC Plus Wi-Fi Automatic Robotic Pool Vacuum Cleaner70Readable
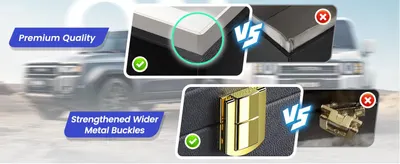 lanpard Faraday Box for Car Keys70Readable
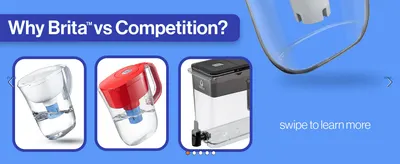 Brita Water Filter Pitcher for Tap and Drinking Water with 1 Standard Filter70Readable
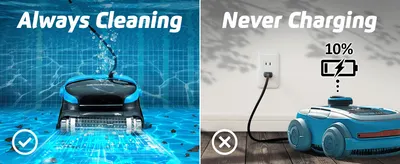 Dolphin Nautilus CC Plus Wi-Fi Automatic Robotic Pool Vacuum Cleaner70Readable
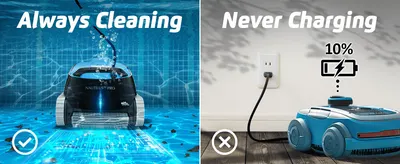 Dolphin Nautilus CC Pro Wi-Fi Automatic Robotic Pool Vacuum Cleaner70Readable
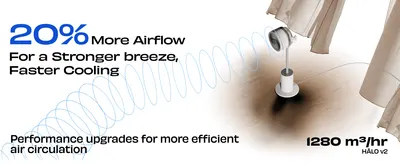 NUUK HALO v2 3D Air Circulation Tower Fan with Mood Lamp69Readable
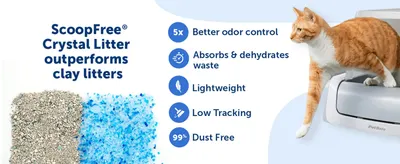 PetSafe ScoopFree Crystal Cat Litter & Refill Tray with Lid69Readable
| Measured | Best 10 | The rest | Accessibility floor |
|---|---|---|---|
| Headline height, % of image | 11.9% | 7.3% | 6.5% on a search tile |
| Headline contrast | Lc 86 | Lc 65 | Lc 45 minimum, 60 preferred |
| Text area, % of image | 11.5% | 10.6% | — |
| Separate blocks of text | 7.5 | 11 | — |
| Headline set bold | 70% | 24% | — |
| Still readable blurred to tile size | 40% | 4% | — |
Measured on 94 images with OCR: text height as a share of the image, APCA contrast against what sits behind the text, and whether the headline can still be read once the image is blurred to the size a shopper sees in search.
Every example
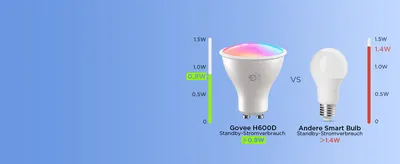 Govee Glühbirne GU10 LED RGBWW
 Govee Glühbirne GU10 LED RGBWW
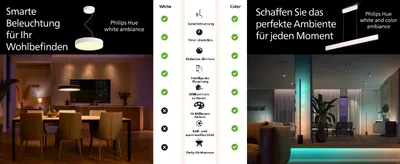 Philips Hue
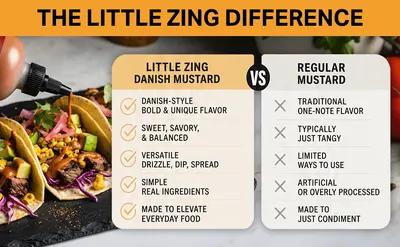 Little Zing Danish Mustard
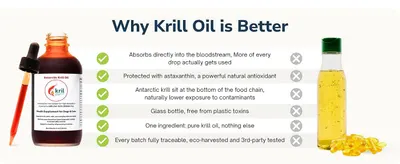 kril™ Antarctic Krill Oil Liquid Supplement for Dogs & Cats
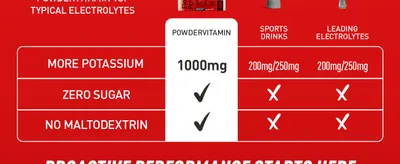 PowderVitamin Electrolytes Powder Plus
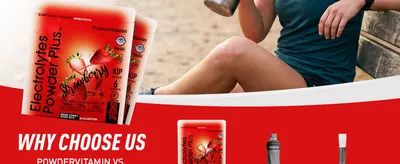 PowderVitamin Electrolytes Powder Plus
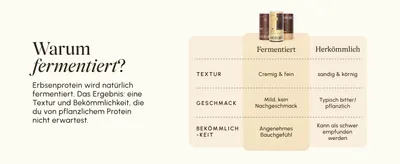 VETAIN Veganes Proteinpulver Vanille
 VETAIN Veganes Proteinpulver Vanille
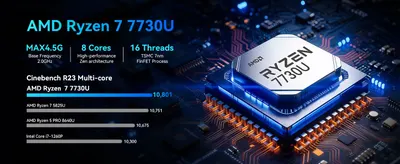 GMKtec M5 Ultra Mini PC AMD Ryzen 7 7730U (Turbo 4.5GHz) Upgradeable RAM
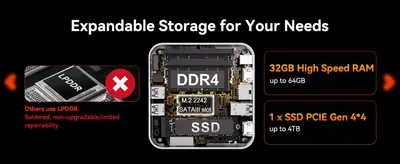 GEEKOM A7 Mini PC
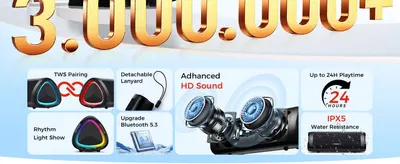 Bluetooth Speaker
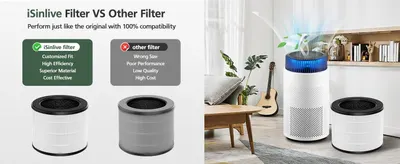 2 Pack Airmega 100 Filter Replacement For Coway Airmega 100 Air Purifier
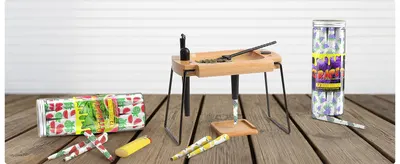 Large Bamboo Box with Combination Lock
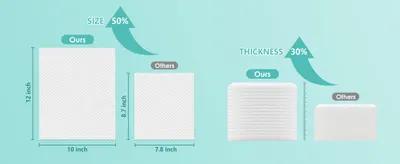 Ditoi Face Towels XL
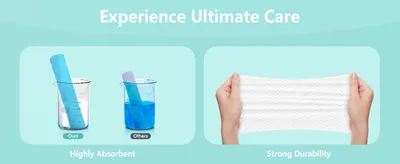 Ditoi Face Towels XL
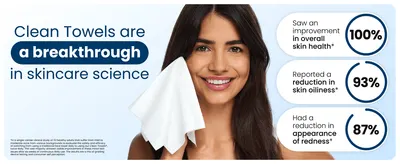 Clean Skin Club Clean Towels XL®
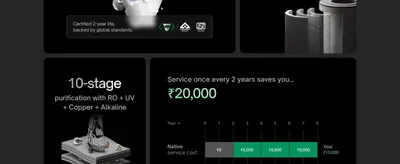 Native M2 Pro Water Purifier by Urban CompanyNUUK HALO v2 3D Air Circulation Tower Fan with Mood LampNUUK HALO v2 3D Air Circulation Tower Fan with Mood Lamp
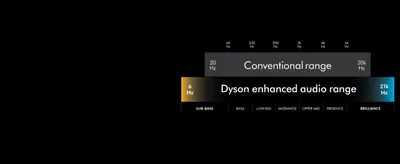 Dyson OnTrac™ Headphones
 Dyson 360 Vis Nav Robot Vacuum
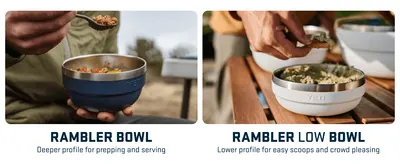 YETI Rambler 24 oz Food Jar
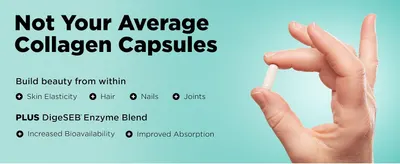 Vital Vitamins Multi Collagen Peptides Complex for Women & Men
 NIMO 15.6" IPS FHD-Gaming-Laptop
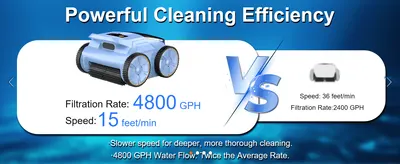 (2025 New) Robotic Pool Vacuum
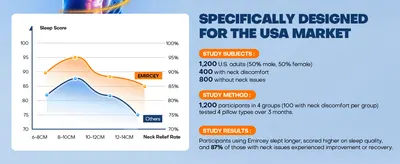 Sleep Doctor Approved Cervical Neck Pillow for Sleeping
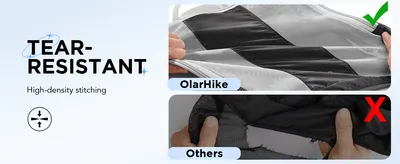 10 Set Compression Packing Cubes for Travel Essentials
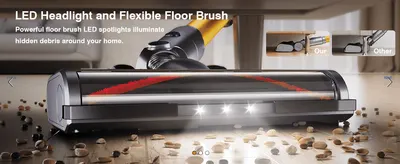 MBYULO Cordless Vacuum Cleaner
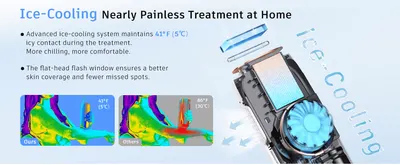 Laser Hair Removal with 5℃ Ice Cooling
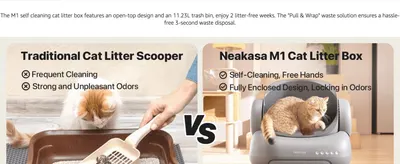 Neakasa M1 Open-Top Self Cleaning Cat Litter Box
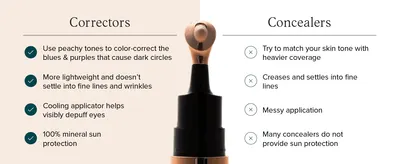 DRMTLGY Luminous Eye Corrector SPF 41
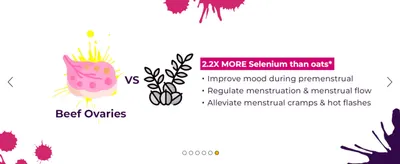 Primal Queen Female-Optimized Beef Organ Superfood Supplement (Beef Liver
 Dreo Energiesparender Heizlüfter
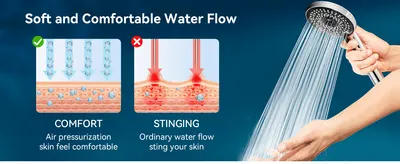 Magichome Shower Head and Hose 2M
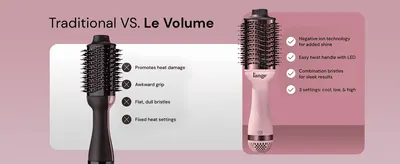 L'ANGE HAIR Le Volume 2-in-1 Titanium Blow Dryer BrushDolphin Nautilus CC Plus Wi-Fi Automatic Robotic Pool Vacuum Cleaner
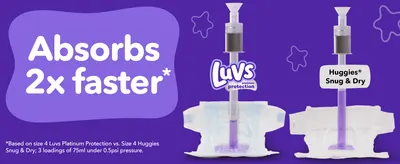 Luvs Diapers
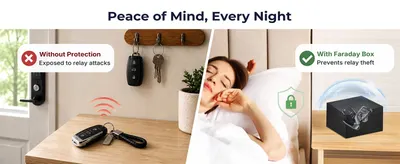 WHonor Faraday Box for Car Keyslanpard Faraday Box for Car Keys
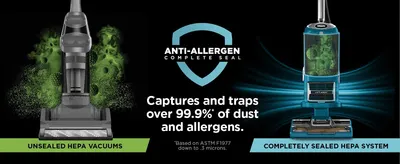 Shark Upright Vacuum
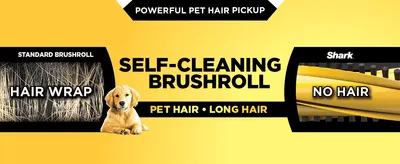 Shark Upright Vacuum
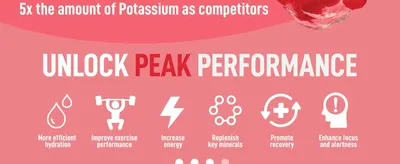 Keppi Keto Electrolytes Powder No Sugar
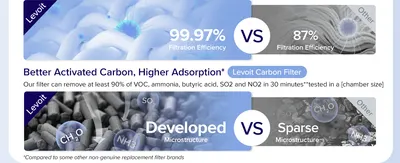 LEVOIT Genuine Core 300-P Replacement Filter
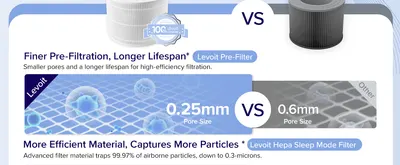 LEVOIT Genuine Core 300-P Replacement FilterPetSafe ScoopFree Crystal Cat Litter & Refill Tray with Lid
 2025 AMD Laptop
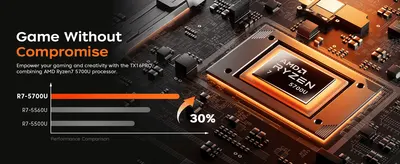 2025 AMD Laptop
Categories that use comparison chart A+ modules most
| Category | Examples | Share | vs library |
|---|---|---|---|
| Health & Household | 22 | 20% | 1.3× |
| Home & Kitchen | 12 | 11% | 1.0× |
| Beauty & Personal Care | 11 | 10% | 1.2× |
| Pet Supplies | 9 | 8% | 1.8× |
| Grocery & Gourmet Food | 7 | 6% | 0.5× |
| Clothing, Shoes & Jewelry | 5 | 5% | 1.2× |
| Electronics | 4 | 4% | 0.5× |
| Musical Instruments | 4 | 4% | 1.1× |
| Tools & Home Improvement | 4 | 4% | 1.1× |
| Baby Products | 3 | 3% | 0.9× |
Common design themes
- Product Comparison6
- Absorption4
- Dust Free4
- Low Tracking4
- Odor Control4
- Crystal vs Clay Litter3
- Lightweight3
- Sealed vs Unsealed HEPA System3
Comparison Chart A+ Modules by category
Related image types
- Single Benefit A+ Modules2,119
- Brand A+ Modules1,543
- Infographic A+ Modules1,491
- Key Stat A+ Modules488
- Lifestyle A+ Modules379
- Product Detail A+ Modules365
- Safety / Compatibility A+ Modules330
- How to Use A+ Modules296
- Use Case A+ Modules294
- Dimension A+ Modules202
- What's in the Box A+ Modules111
- Review A+ Modules91
Brands using comparison chart A+ modules
Our design team makes Amazon listing images, infographics and A+ content. £750 per day, with revisions the next day.
Last example added 2026-10-28 · 108 examples. Image types are tagged by AI and checked by hand in samples.