Amazon Product Detail A+ Module Examples
We have 375 product detail A+ module examples from 290 Amazon listings, under 1% of the library. Home & Kitchen has the most (17%, 1.5× its share of the library). Common themes: Ingredient Breakdown, Feature Callouts and Component Breakdown.
- Examples
- 375
- Listings
- 290
- Share of library
- under 1%
- Top categories
- Home & Kitchen, Clothing, Shoes & Jewelry and Beauty & Personal Care
The best product detail A+ module examples
Ranked by a score built from what the image does at a glance: how big and how readable its message is, measured, plus a design judgement. 307 images in this collection are scored.
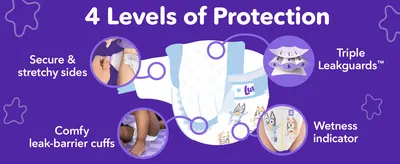 Luvs Diapers88Reads at a glance
 Reffair Caligo 900 Ultrasonic Humidifier 6L83Reads at a glance
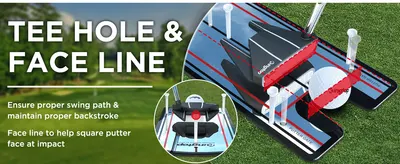 KINGTOP Classic Golf Putting Mirror79Readable
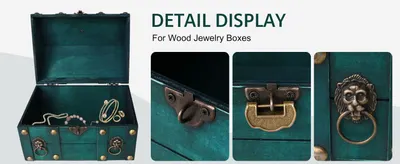 Decorative Wood Treasure Chest Box with Small Metal Lock70Readable
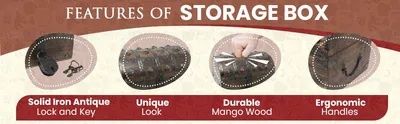 Nautical Cove Wooden Treasure Chest with Padded Velvet Lining and Antique Lock with…70Readable
 Maybelline Instant Age Rewind Eraser Treatment Makeup with SPF 1870Readable
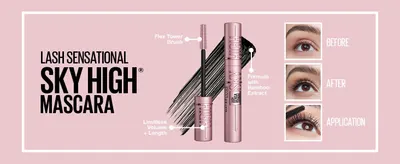 Maybelline Lash Sensational Sky High Washable Mascara70Readable
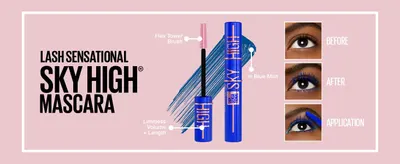 Maybelline Lash Sensational Sky High Washable Mascara70Readable
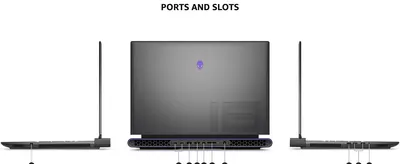 Alienware M18 R2 Gaming Laptop70Readable
 2 Pack Nxtrnd Classic Mouth Guard for All Sports (Transparent) : Sports & Outdoors70Readable
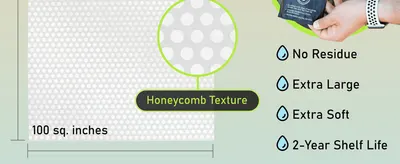 Alcala Deodorizing Body Wipes Individual Shower Wipes 100% Pure Biodegradable Bamboo Wet…70Readable
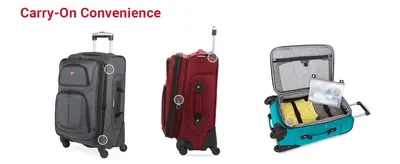 SwissGear Sion Softside Expandable Luggage70Readable
| Measured | Best 28 | The rest | Accessibility floor |
|---|---|---|---|
| Headline height, % of image | 9.3% | 6.4% | 6.5% on a search tile |
| Headline contrast | Lc 80 | Lc 64 | Lc 45 minimum, 60 preferred |
| Text area, % of image | 6.7% | 8.9% | — |
| Separate blocks of text | 4 | 9 | — |
| Headline set bold | 25% | 24% | — |
| Still readable blurred to tile size | 14% | 0% | — |
Measured on 278 images with OCR: text height as a share of the image, APCA contrast against what sits behind the text, and whether the headline can still be read once the image is blurred to the size a shopper sees in search.
Every example
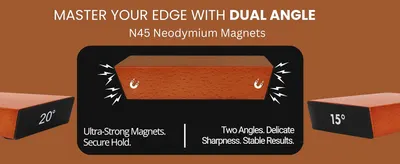 Stainless Steel Rolling Knife Sharpener Kit with Diamond & Ceramic Disc (2 ANGLE)
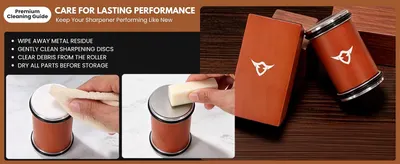 Stainless Steel Rolling Knife Sharpener Kit with Diamond & Ceramic Disc (2 ANGLE)
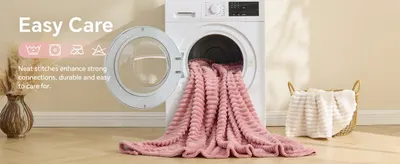 BEDELITE 3D Ribbed Jacquard Pink Fleece Throw Blanket for Couch
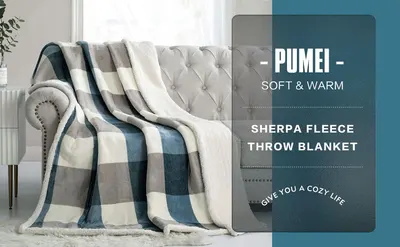 PU MEI Sherpa Fleece Throw Blanket 60" x 80" Reversible Plush Fluffy Large Big Blanket…
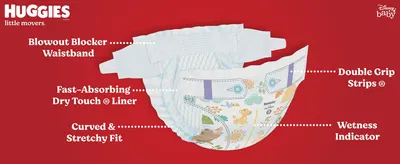 Huggies Little Movers Diapers Size 4
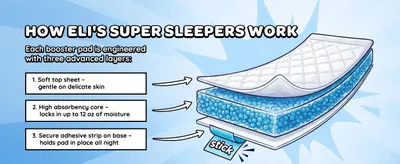 Eli with Love Super Sleepers Baby Diaper Booster Pads
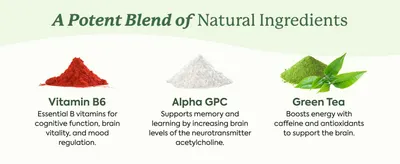 Plant People WonderFocus Mushroom Gummies with Lion’s Mane & Cordyceps 60ct
 Plant People WonderFocus Mushroom Gummies with Lion’s Mane & Cordyceps 60ct
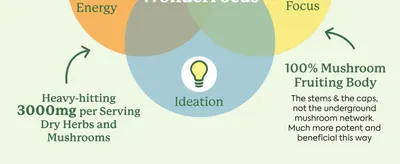 Plant People WonderFocus Mushroom Gummies with Lion’s Mane & Cordyceps 60ct
 OM MUSHROOM SUPERFOOD Master Blend Mushroom Gummies
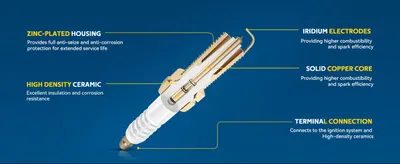 PHILTOP UF749 Ignition Coil Pack and Spark Plug Kit Fits Honda Civic
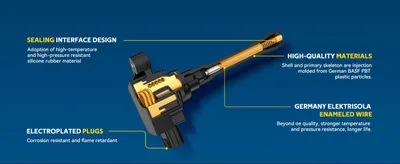 PHILTOP UF749 Ignition Coil Pack and Spark Plug Kit Fits Honda Civic
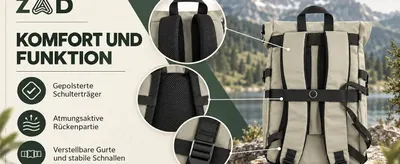 ZΛD Rolltop Rucksack für Damen & Herren
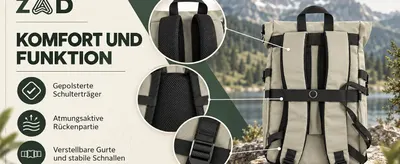 ZΛD Rolltop Rucksack für Damen & Herren
 SEDUCTIFY
 plusOne Dual Rabbit Vibrator
 Roundup Path Weedkiller
 Healing Crystal Candle Gift Set
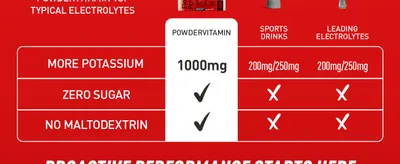 PowderVitamin Electrolytes Powder Plus
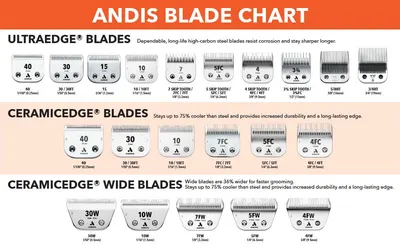 Andis
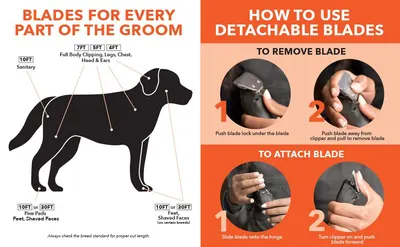 Andis
 GMKtec M5 Ultra Mini PC AMD Ryzen 7 7730U (Turbo 4.5GHz) Upgradeable RAM
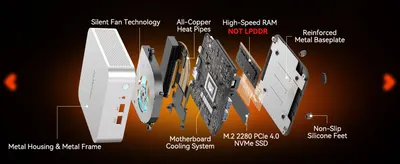 GEEKOM A7 Mini PC
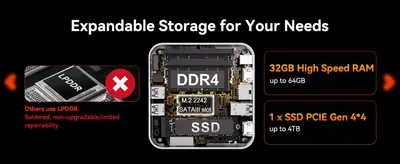 GEEKOM A7 Mini PC
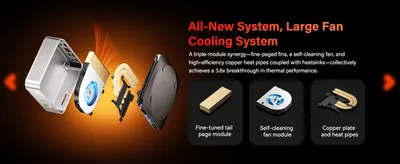 GEEKOM A7 Mini PC
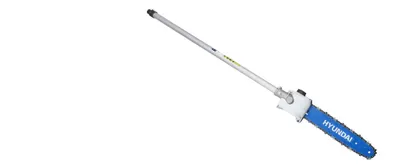 Hyundai 52cc Petrol Garden 5-in-1 Multi Tool
 Hyundai 52cc Petrol Garden 5-in-1 Multi Tool
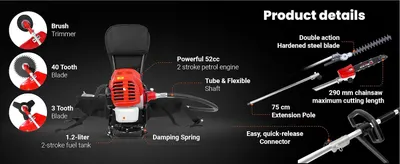 BU-KO 52cc Backpack Long Reach Multi Functional Petrol Garden Tool: Strimmers and Brush…
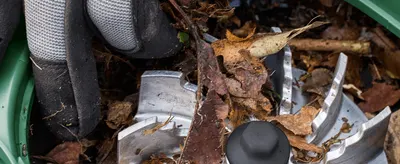 Bosch Electric Leaf Blower and Vacuum UniversalGardenTidy 3000
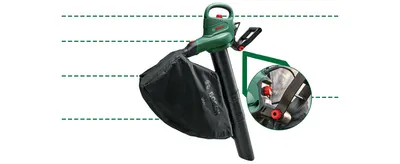 Bosch Electric Leaf Blower and Vacuum UniversalGardenTidy 3000
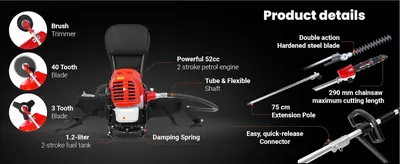 BU-KO 52cc Backpack Long Reach Multi Functional Petrol Garden Tool: Strimmers and Brush…
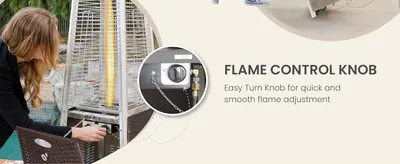 BU-KO Outdoor Patio Gas Heater
 2 Pack Airmega 100 Filter Replacement For Coway Airmega 100 Air Purifier
 2 Pack Airmega 100 Filter Replacement For Coway Airmega 100 Air Purifier
 2 Pack Airmega 100 Filter Replacement For Coway Airmega 100 Air Purifier
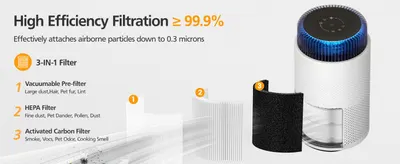 2 Pack Airmega 100 Filter Replacement For Coway Airmega 100 Air Purifier
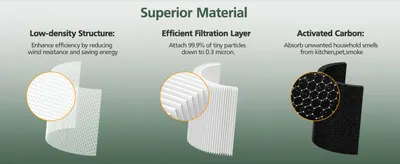 2 Pack Airmega 100 Filter Replacement For Coway Airmega 100 Air PurifierDecorative Wood Treasure Chest Box with Small Metal Lock
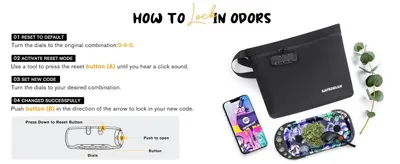 Large Bamboo Box with Combination Lock
 Large Bamboo Box with Combination Lock
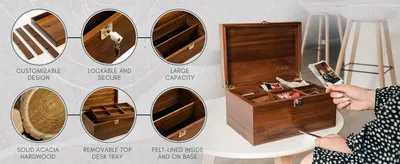 Public House Locking Wooden Keepsake Box
 Clean Skin Club Clean Towels XL®
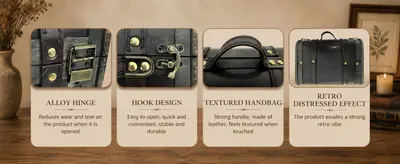 Vintage Treasure Chest
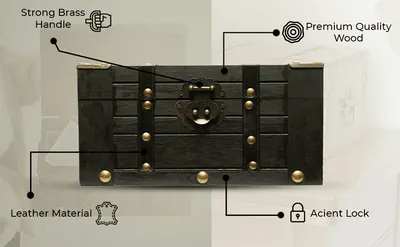 Wooden Treasure Chest with Leather Straps
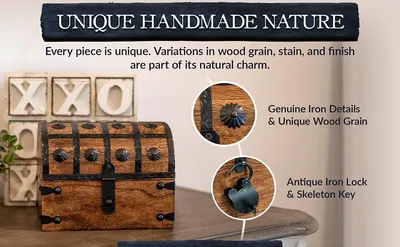 Nautical Cove Wooden Pirate Treasure Chest with Lock & Skeleton Key SmallNautical Cove Wooden Treasure Chest with Padded Velvet Lining and Antique Lock with…
 OBTANIM 4 Pack 4 Gallon Galvanized Ice Buckets Metal Champagne Drink Cooler Ice Tub with…
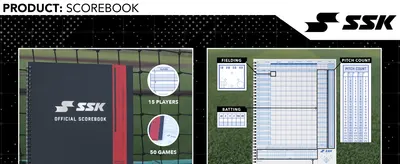 SSK 50 Game Official Scorebook Baseball + Softball
Categories that use product detail A+ modules most
| Category | Examples | Share | vs library |
|---|---|---|---|
| Home & Kitchen | 61 | 17% | 1.5× |
| Clothing, Shoes & Jewelry | 52 | 14% | 3.6× |
| Beauty & Personal Care | 36 | 10% | 1.2× |
| Health & Household | 35 | 9% | 0.6× |
| Baby Products | 28 | 8% | 2.3× |
| Pet Supplies | 15 | 4% | 0.9× |
| Electronics | 12 | 3% | 0.5× |
| Patio, Lawn & Garden | 10 | 3% | 1.0× |
| Sports & Outdoors | 9 | 2% | 0.6× |
| Automotive | 4 | 1% | 0.7× |
Common design themes
- Ingredient Breakdown20
- Feature Callouts17
- Component Breakdown9
- Component Callouts9
- Interactive Hotspots9
- Wetness Indicator7
- Ingredient Callouts6
- Internal Components6
Product Detail A+ Modules by category
- Home & Kitchen65
- Clothing, Shoes & Jewelry52
- Beauty & Personal Care36
- Health & Household35
- Baby Products30
- Pet Supplies15
- Electronics12
Related image types
- Single Benefit A+ Modules2,150
- Brand A+ Modules1,587
- Infographic A+ Modules1,540
- Key Stat A+ Modules492
- Lifestyle A+ Modules453
- Safety / Compatibility A+ Modules345
- How to Use A+ Modules305
- Use Case A+ Modules300
- Dimension A+ Modules206
- What's in the Box A+ Modules113
- Comparison Chart A+ Modules111
- Before and After A+ Modules94
Brands using product detail A+ modules
- Hanes72
- Pampers213
- Dyson314
- Intex127
- Garmin74
- Shark160
- Lenovo69
- LEVOIT123
- adidas57
- HP448
- HUGGIES147
- MANSCAPED43
Our design team makes Amazon listing images, infographics and A+ content. £750 per day, with revisions the next day.
Last example added 2026-11-02 · 369 examples. Image types are tagged by AI and checked by hand in samples.