Comparison Chart Image Examples for Automotive
We have 33 comparison chart image examples from 27 Automotive listings on Amazon. They make up 2% of Automotive images, against 1% across the library. Sellers place them most often as image 4, 3 or 2 (58% of examples with a known position). Common themes: Product Quality, Stronger Protection and Corrosion Control Performance.
- Examples
- 33
- Listings
- 27
- Share of Automotive images
- 2%
- Most common position
- Image 4 (24%)
- All examples
- Comparison Chart Images · Automotive
The best comparison chart image examples for Automotive
Ranked by a score built from what the image does at a glance: how big and how readable its message is, measured, plus a design judgement. 31 images in this collection are scored.
 Castrol EDGE 5W-30 Advanced Full Synthetic Motor Oil97Reads at a glance
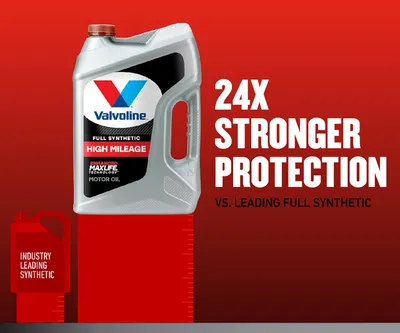 Valvoline Full Synthetic High Mileage with MaxLife Technology 5W-20 Motor Oil 5 Quart89Reads at a glance
 TRICO Gold 22" + 22" Premium Automotive Replacement Windshield Wiper Blades (Set of 2)79Readable
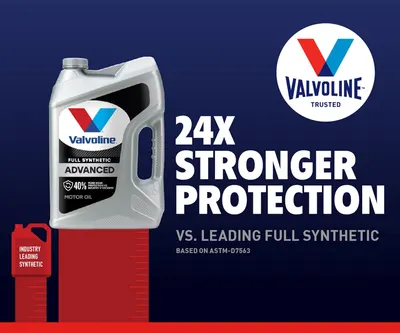 Valvoline Advanced Full Synthetic SAE 5W-30 Motor Oil 5 QT77Readable
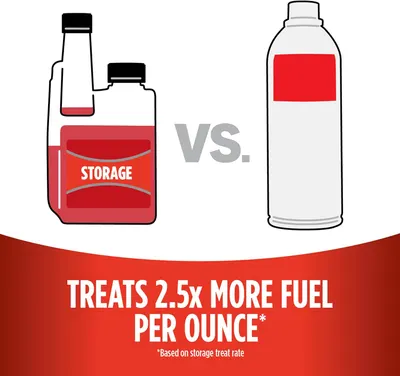 STA-BIL Storage Fuel Stabilizer76Readable
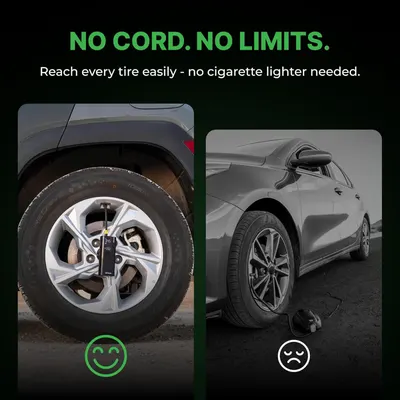 Airmoto Tire Inflator Portable Air Compressor64Readable
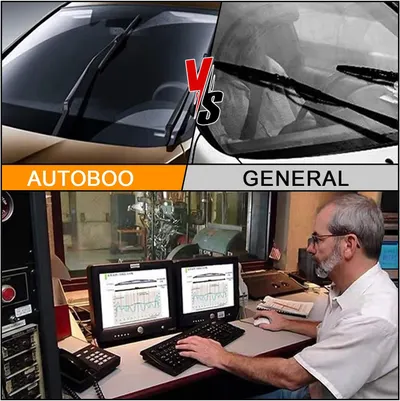 AUTOBOO 26" and 18" Windshield Wipers Blades (Pack Of 2)62Readable
Every example
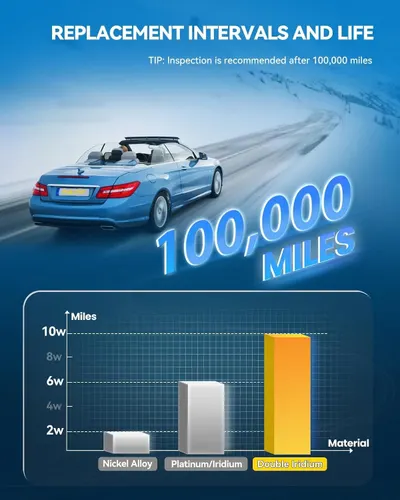 PHILTOP UF749 Ignition Coil Pack and Spark Plug Kit Fits Honda Civic
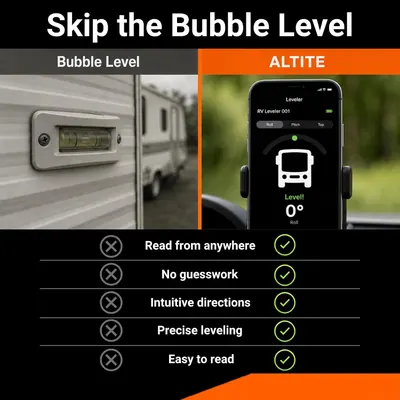 Wireless Rv Leveling System
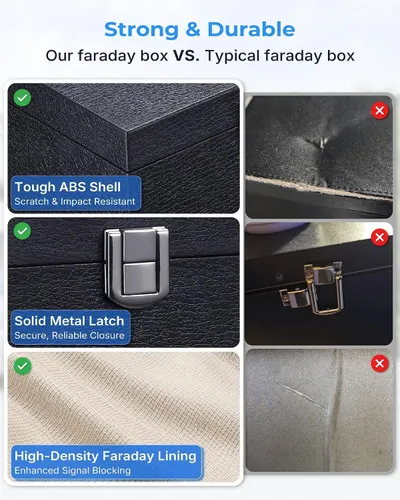 WHonor Faraday Box for Car Keys
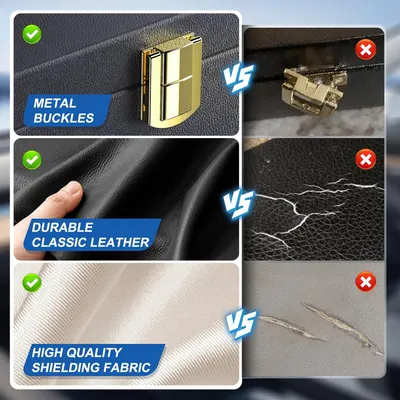 lanpard Faraday Box for Car Keys
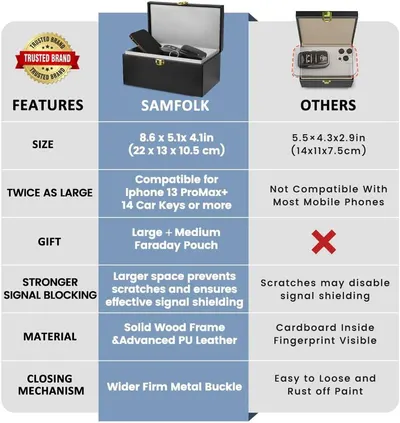 Samfolk Faraday Box and Pouch 2 Pack
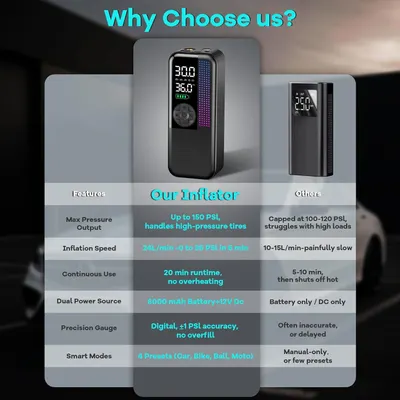 Tire Inflator Portable Air Compressor
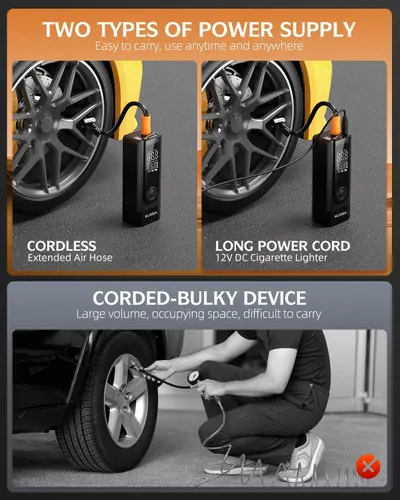 Tire Inflator Portable Air CompressorAirmoto Tire Inflator Portable Air Compressor
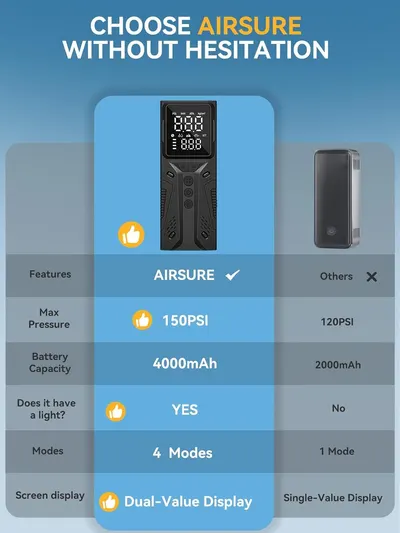 Tire Inflator Portable Air Compressor
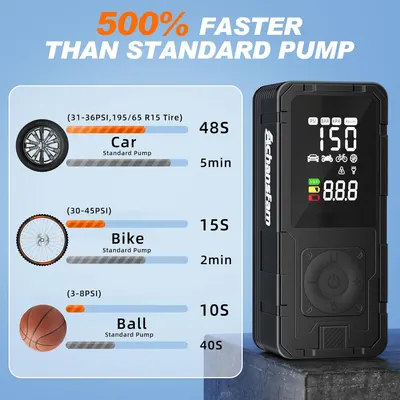 P10 Portable Air Compressor
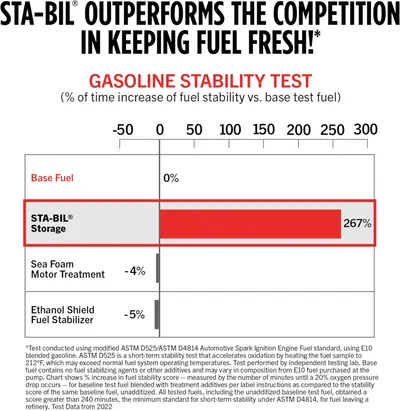 STA-BIL Storage Fuel Stabilizer
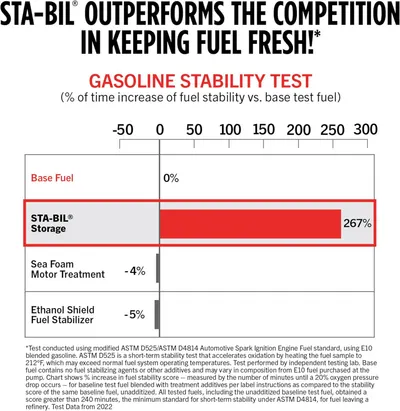 STA-BIL Storage Fuel Stabilizer
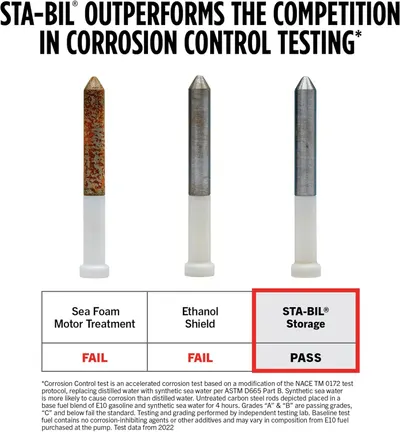 STA-BIL Storage Fuel Stabilizer
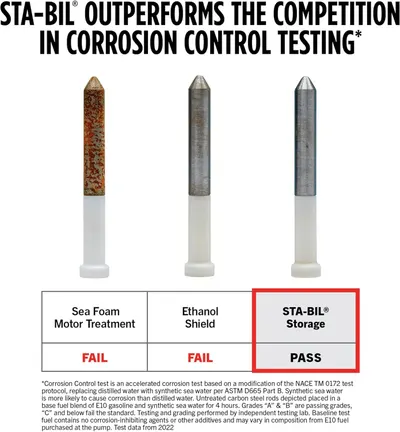 STA-BIL Storage Fuel StabilizerSTA-BIL Storage Fuel Stabilizer
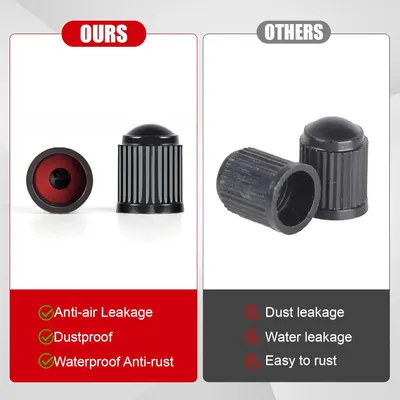 100PCS Tire Valve Caps
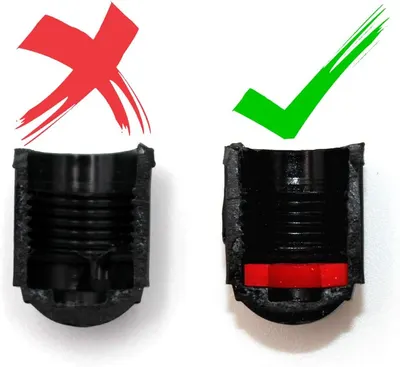 (30 Pack) Tire Stem Valve Caps
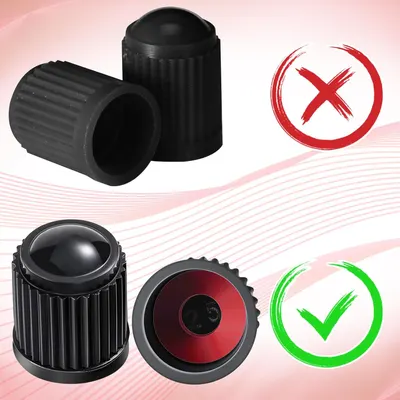 Outus 20 Pcs Tire Valve Stem Caps Car Tire Caps Plastic Universal Black Valve Stem…
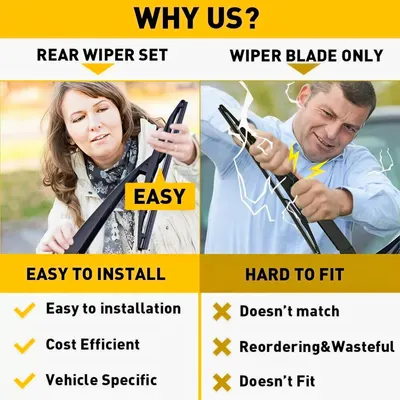 #42709519 Rear Window Wiper Blade with Arm for Chevrolet Trailblazer 2019-2022AUTOBOO 26" and 18" Windshield Wipers Blades (Pack Of 2)
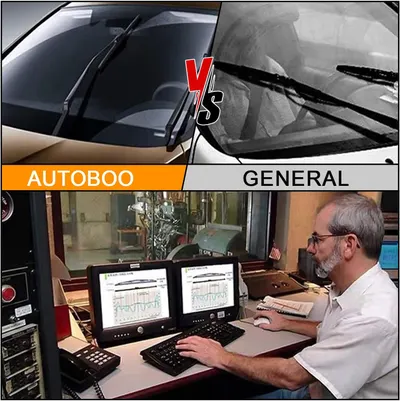 AUTOBOO 26" and 16" Windshield Wipers Blades (Pack Of 2)
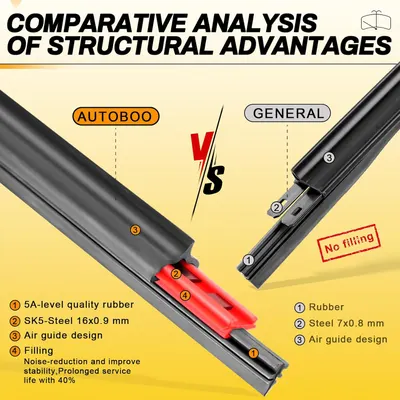 AUTOBOO 26" and 18" Windshield Wipers Blades (Pack Of 2)TRICO Gold 22" + 22" Premium Automotive Replacement Windshield Wiper Blades (Set of 2)
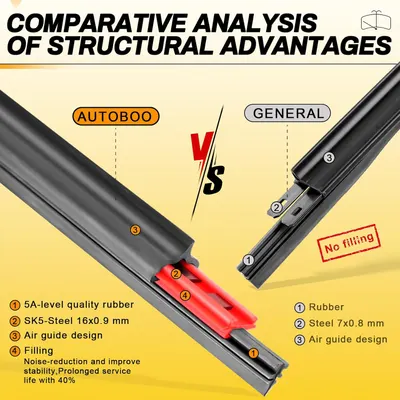 AUTOBOO 26" and 16" Windshield Wipers Blades (Pack Of 2)
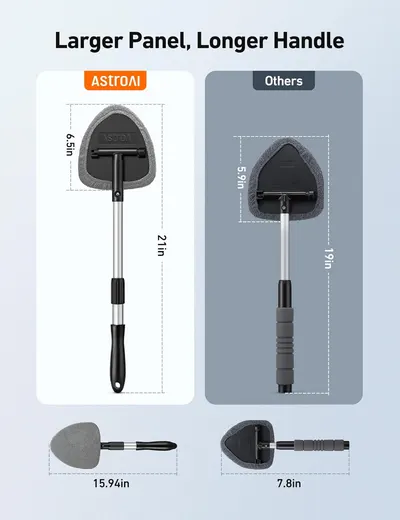 AstroAI Windshield Cleaner Tool
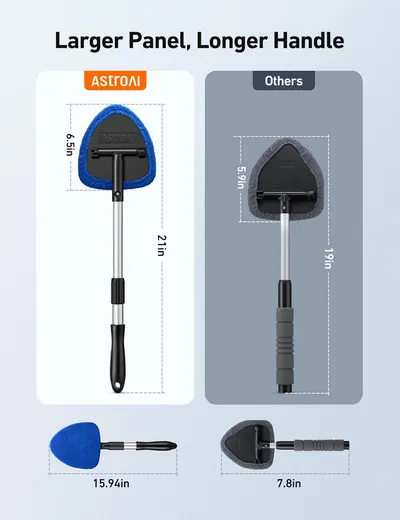 AstroAI Windshield Cleaner ToolCastrol EDGE 5W-30 Advanced Full Synthetic Motor OilValvoline Full Synthetic High Mileage with MaxLife Technology 5W-20 Motor Oil 5 QuartValvoline Advanced Full Synthetic SAE 5W-30 Motor Oil 5 QT
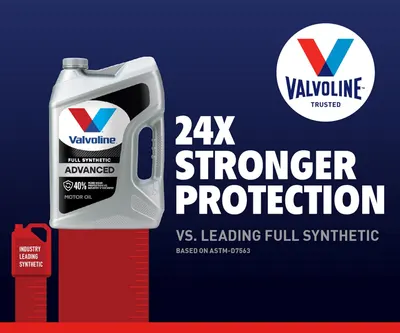 Valvoline Advanced Full Synthetic SAE 0W-20 Motor Oil 5 QT
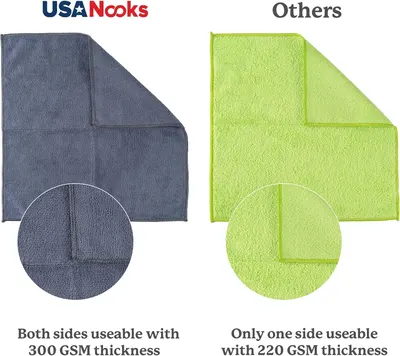 USANOOKS Microfiber Cleaning Cloth Grey
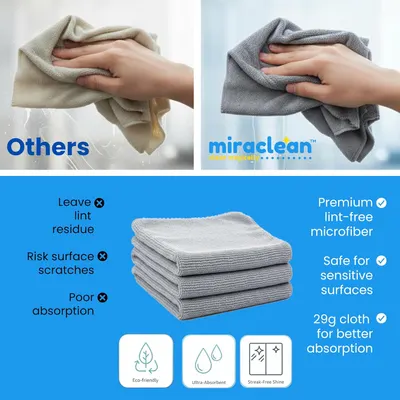 Microfiber Cleaning Cloth Grey 12 Pack Premium Microfiber Towels for Cars
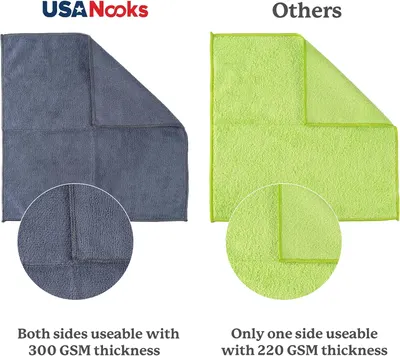 USANOOKS Microfiber Cleaning Cloth Grey
Where comparison chart images sit in Automotive listings
| Image number | Examples | Share |
|---|---|---|
| Image 2 | 5 | 15% |
| Image 3 | 6 | 18% |
| Image 4 | 8 | 24% |
| Image 5 | 5 | 15% |
| Image 6 | 2 | 6% |
| Image 7 | 4 | 12% |
| Image 8 | 3 | 9% |
Common design themes
- Product Quality3
- Stronger Protection3
- Corrosion Control Performance2
- Durability2
- Fuel Stability Performance2
- Larger Panel2
- Longer Handle2
- Material Quality2
More Automotive image types
- Secondary Images1,034
- Single Benefit Images315
- Main Images183
- Infographic Images160
- Use Case Images143
- Product Main Images138
- How to Use Images119
- What's in the Box Images65
- Key Stat Images59
- Dimension Images59
- Main Images with Accessories56
- Main Images with Packaging46
- Product Detail Images46
- Safety / Compatibility Images44
- Premium A+ Modules41
- Before and After Images34
- Brand Images30
- Main Images with Variants25
- Lifestyle Images25
- Single Benefit A+ Modules18
- Infographic A+ Modules17
- Seasonal Images15
Comparison Chart Images in other categories
- Health & Household164
- Electronics129
- Home & Kitchen119
- Sports & Outdoors98
- Tools & Home Improvement97
- Beauty & Personal Care95
- Cell Phones & Accessories57
- Musical Instruments54
- Pet Supplies53
- Office Products49
- Grocery & Gourmet Food43
- Arts, Crafts & Sewing36
- Baby Products36
- Patio, Lawn & Garden34
- Appliances23
- Clothing, Shoes & Jewelry22
- Toys & Games13
Automotive listings with full image stacks
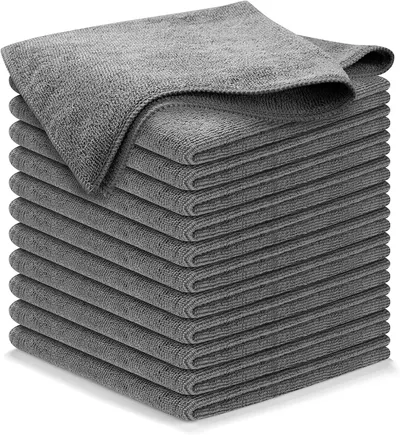 USANOOKS Microfiber Cleaning Cloth Grey8 gallery images · #6 in Automotive
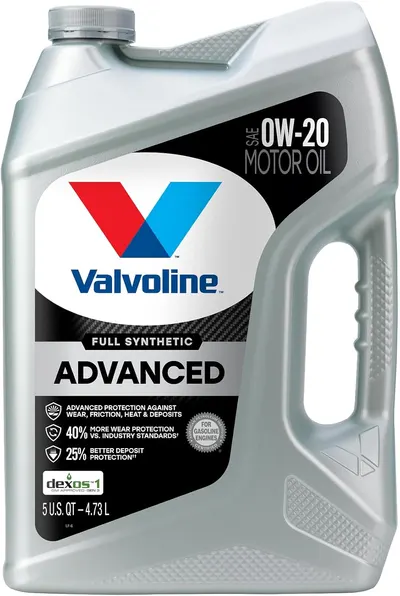 Valvoline Advanced Full Synthetic SAE 0W-20 Motor Oil 5 QT8 gallery images · #7 in Automotive
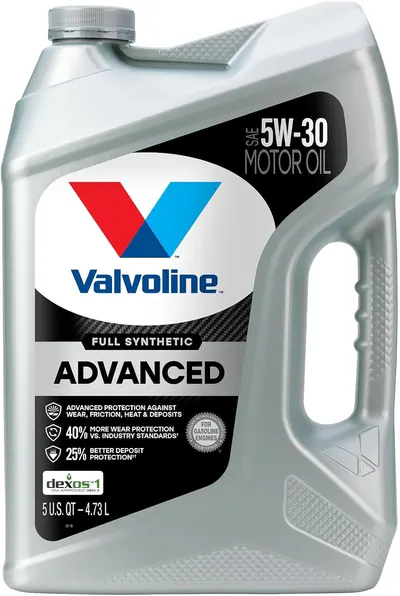 Valvoline Advanced Full Synthetic SAE 5W-30 Motor Oil 5 QT8 gallery images · #7 in Automotive
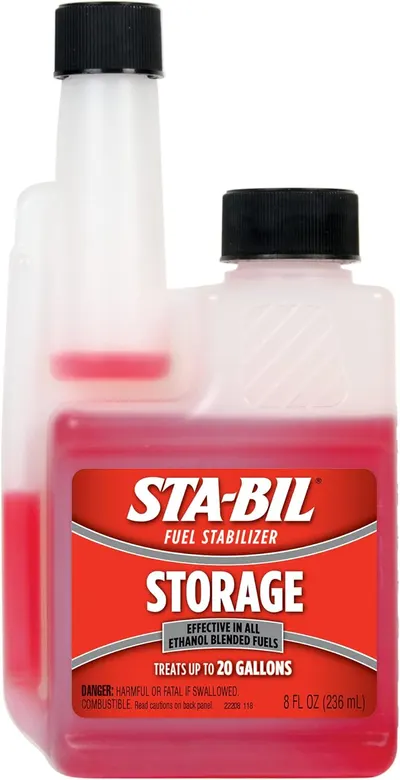 STA-BIL Storage Fuel Stabilizer12 gallery images · #9 in Automotive
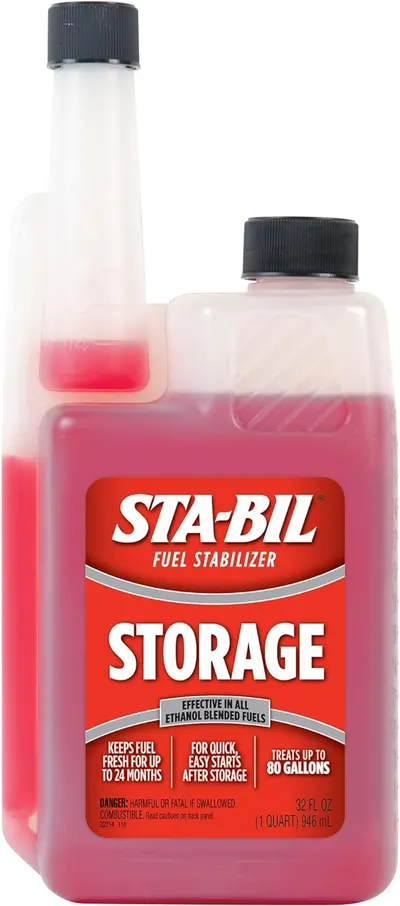 STA-BIL Storage Fuel Stabilizer12 gallery images · #9 in Automotive
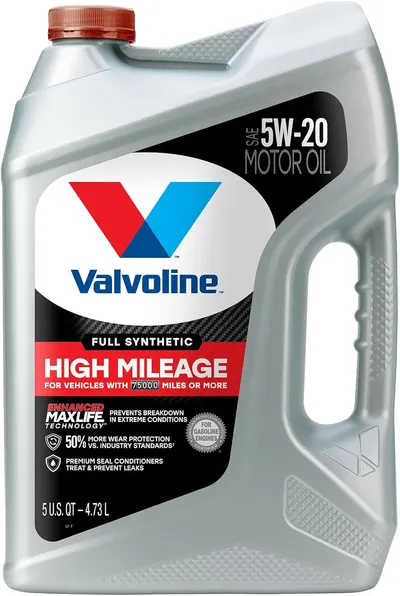 Valvoline Full Synthetic High Mileage with MaxLife Technology 5W-20…8 gallery images · #9 in Automotive
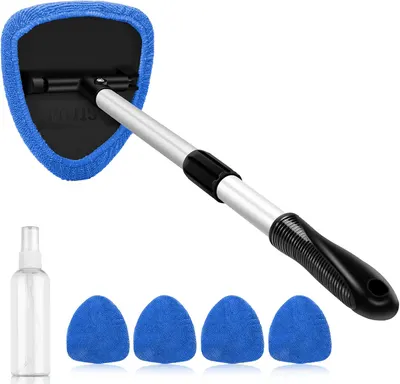 AstroAI Windshield Cleaner Tool8 gallery images · #15 in Automotive
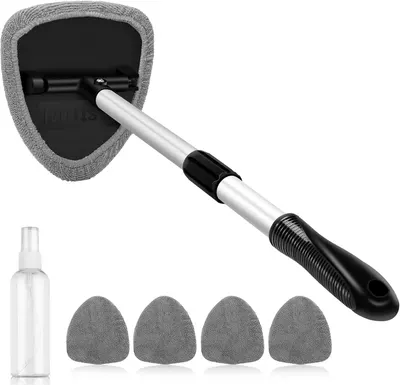 AstroAI Windshield Cleaner Tool8 gallery images · #15 in Automotive
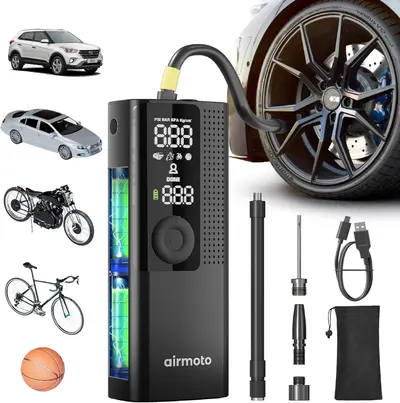 Airmoto Tire Inflator Portable Air Compressor9 gallery images · #35 in Automotive
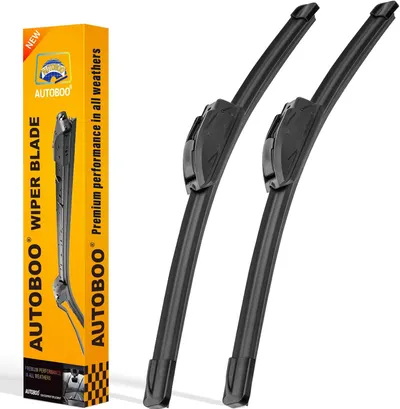 AUTOBOO 26" and 18" Windshield Wipers Blades (Pack Of 2)8 gallery images · #35 in Automotive
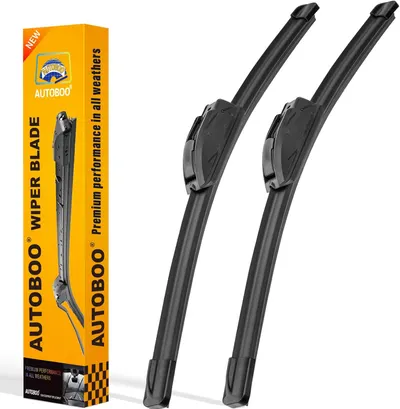 AUTOBOO 26" and 16" Windshield Wipers Blades (Pack Of 2)8 gallery images · #35 in Automotive
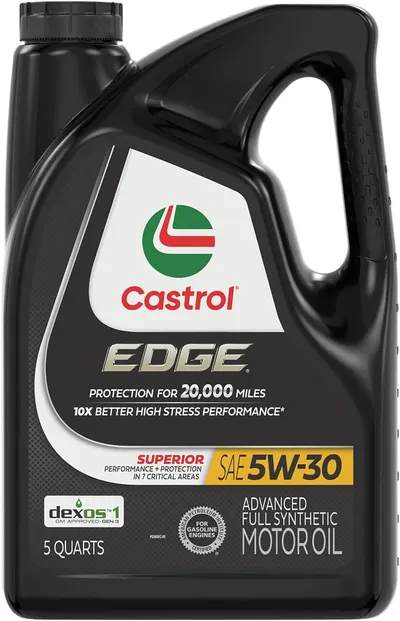 Castrol EDGE 5W-30 Advanced Full Synthetic Motor Oil12 gallery images · #290 in Automotive
Automotive brands using comparison chart images
Automotive product niches
- Motor Oil73
- Windshield Wiper Blades76
- Tire Stem Caps65
- Fuel Stabilizer65
- Microfiber Cleaning Cloth142
- Tire Air Compressor85
- Windshield Cleaner Tool76
Our design team makes Amazon listing images, infographics and A+ content. £750 per day, with revisions the next day.
Last example added 2026-10-30 · 33 examples. Image types are tagged by AI and checked by hand in samples.