Infographic Image Examples for Automotive
We have 160 infographic image examples from 75 Automotive listings on Amazon. They make up 12% of Automotive images, against 8% across the library. Sellers place them most often as image 2, 3 or 5 (56% of examples with a known position). Common themes: High Quality, Machine Washable and Lint Free.
- Examples
- 160
- Listings
- 75
- Share of Automotive images
- 12%
- Most common position
- Image 2 (24%)
- All examples
- Infographic Images · Automotive
The best infographic image examples for Automotive
Ranked by a score built from what the image does at a glance: how big and how readable its message is, measured, plus a design judgement. 160 images in this collection are scored.
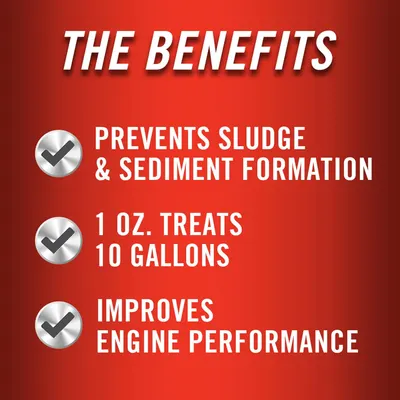 STA-BIL (22255) Diesel Fuel Stabilizer And Performance Improver100Reads at a glance
 Armor All Original Protectant Wipes100Reads at a glance
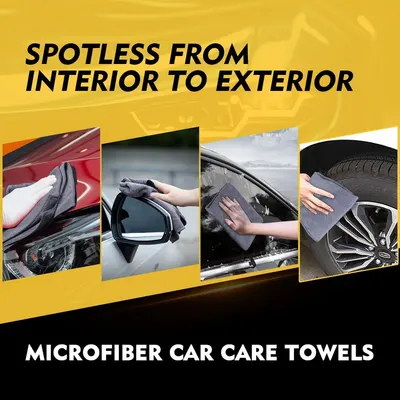 HOMEXCEL Microfiber Cleaning Cloth 12 Pack88Reads at a glance
 C Classy Car Air Freshener Hanging 2 Pack87Reads at a glance
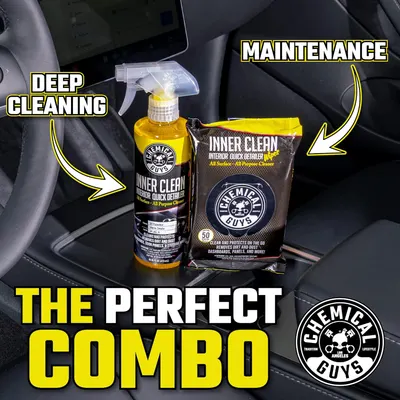 Chemical Guys InnerClean Interior Quick Detailer & Protectant Wipes86Reads at a glance
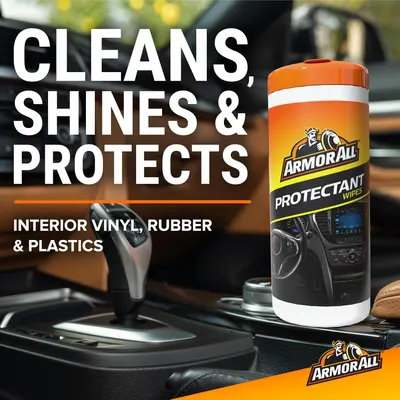 Armor All Protectant85Reads at a glance
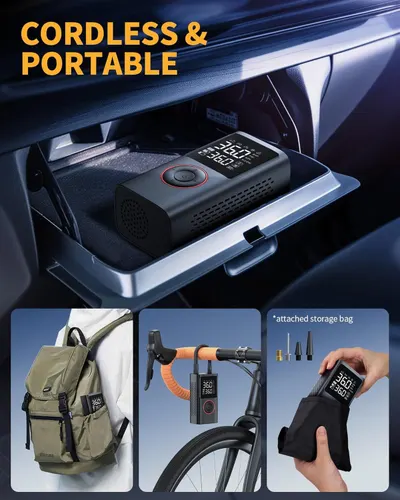 Powools Tire Inflator Portable Air Compressor85Reads at a glance
 HoogaLife Car Air Freshener Diffuser 2 Pack Hanging Air Freshener Diffuser84Reads at a glance
 Febreze Car Vent Clip84Reads at a glance
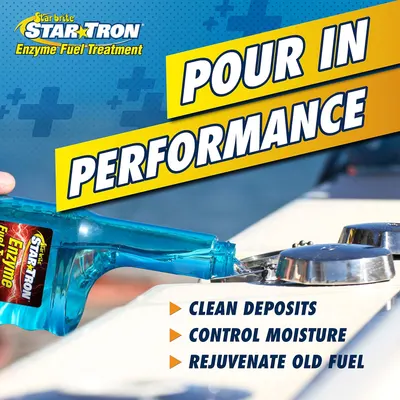 STAR BRITE Star Tron Enzyme Fuel Treatment84Reads at a glance
 Mobil 1 Advanced Full Synthetic Motor Oil 5W-3081Reads at a glance
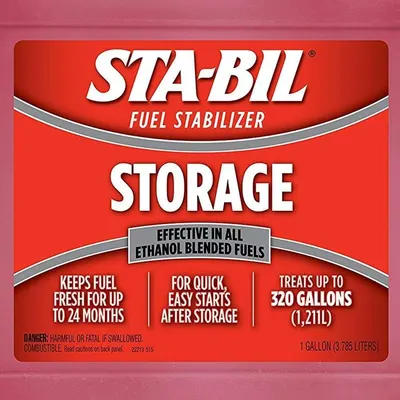 Fuel Stabilizer80Reads at a glance
| Measured | Best 13 | The rest | Accessibility floor |
|---|---|---|---|
| Headline height, % of image | 15.4% | 5.8% | 6.5% on a search tile |
| Headline contrast | Lc 81 | Lc 73 | Lc 45 minimum, 60 preferred |
| Text area, % of image | 25.2% | 11.6% | — |
| Separate blocks of text | 8 | 13 | — |
| Headline set bold | 54% | 28% | — |
| Still readable blurred to tile size | 100% | 39% | — |
Measured on 140 images with OCR: text height as a share of the image, APCA contrast against what sits behind the text, and whether the headline can still be read once the image is blurred to the size a shopper sees in search.
Every example
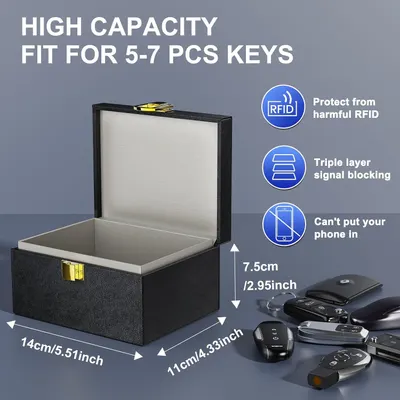 lanpard Faraday Box for Car Keys
 lanpard Faraday Box for Car Keys
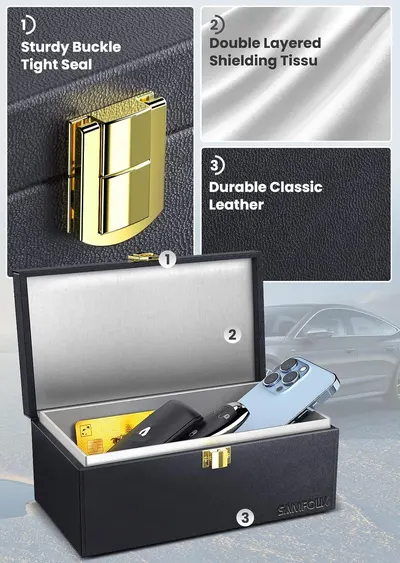 Samfolk Faraday Box and Pouch 2 Pack
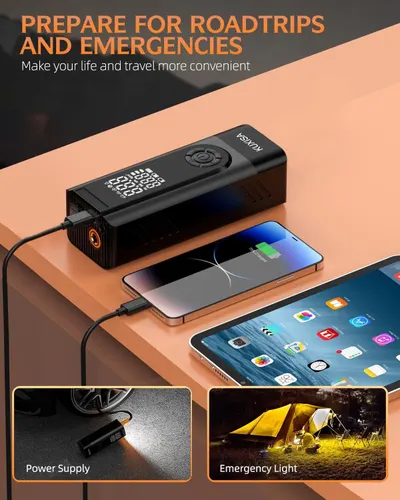 Tire Inflator Portable Air Compressor
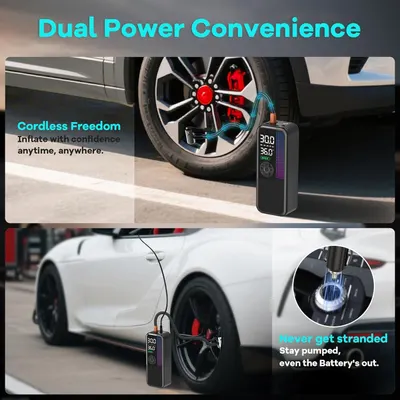 Tire Inflator Portable Air Compressor
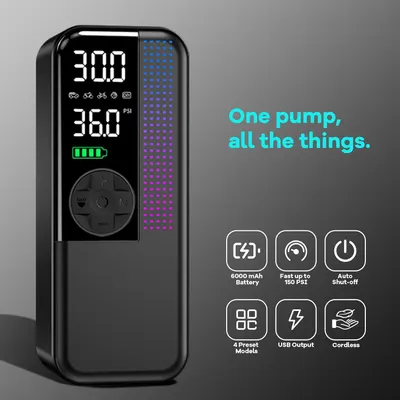 Tire Inflator Portable Air Compressor
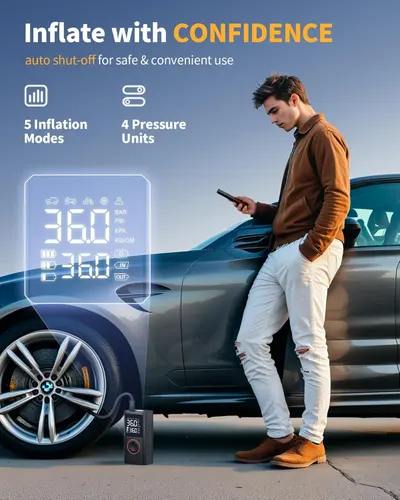 Powools Tire Inflator Portable Air CompressorPowools Tire Inflator Portable Air Compressor
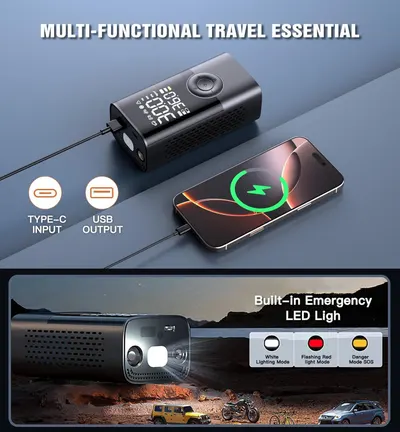 Tire Inflator Portable Air Compressor Portable Cordless Mini Air Pump with Digital…
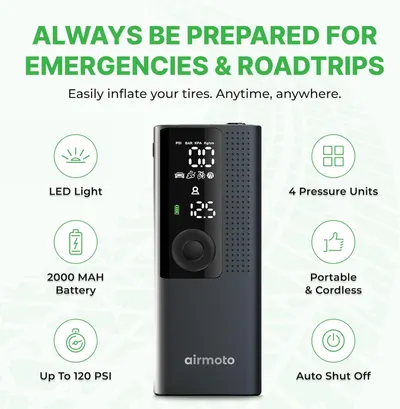 Airmoto Tire Inflator Portable Air Compressor
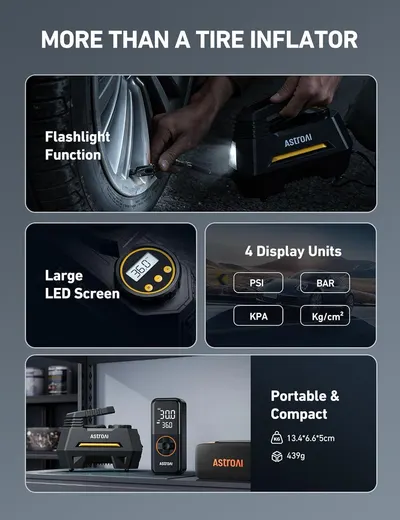 AstroAI AIRUN H Tire Inflator Portable Air Compressor Air Pump for Car Tires-Car…
 FLSEPAMB Bamboo Activated Charcoal Odor Absorber Bags
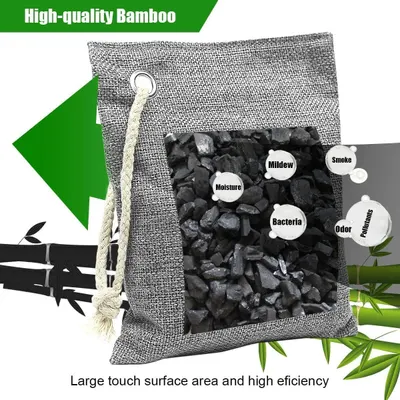 FLSEPAMB Bamboo Activated Charcoal Odor Absorber Bags
 FLSEPAMB Bamboo Activated Charcoal Air Purifying Bags
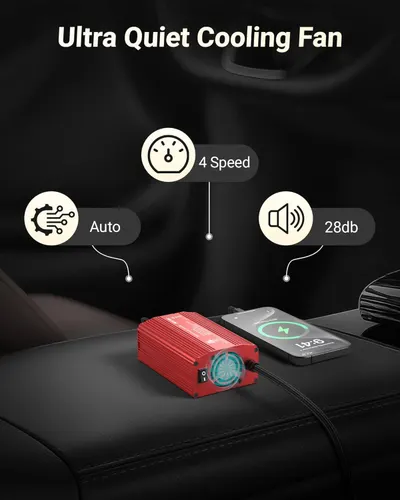 BESTEK Power Inverter DC 12V to AC 110V
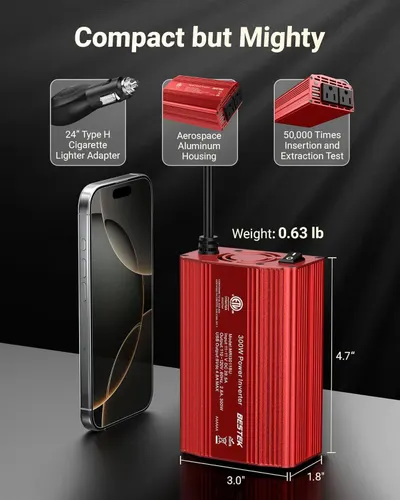 BESTEK Power Inverter DC 12V to AC 110V
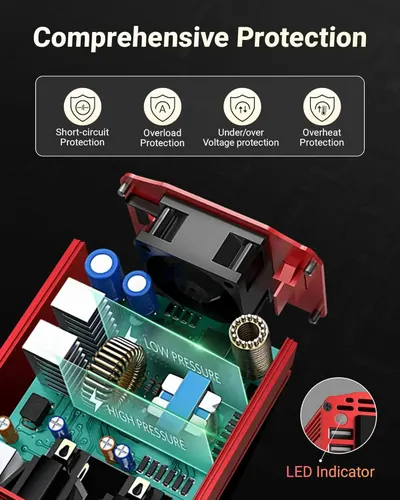 BESTEK Power Inverter DC 12V to AC 110V
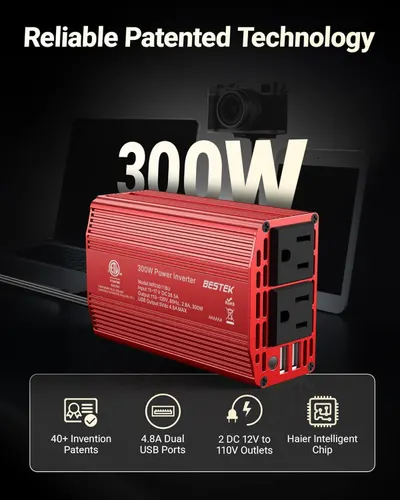 BESTEK Power Inverter DC 12V to AC 110V
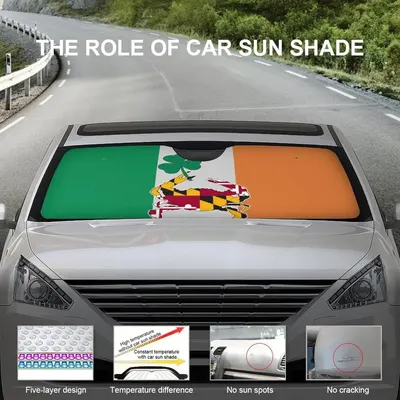 Maryland Shamrock Irish Flag Windshield Sun Shade Foldable Reflective Sun Shade Blocks…
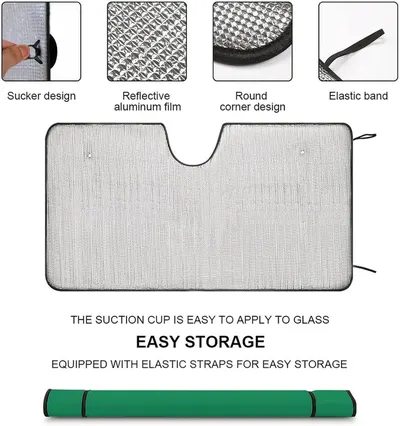 Maryland Shamrock Irish Flag Windshield Sun Shade Foldable Reflective Sun Shade Blocks…
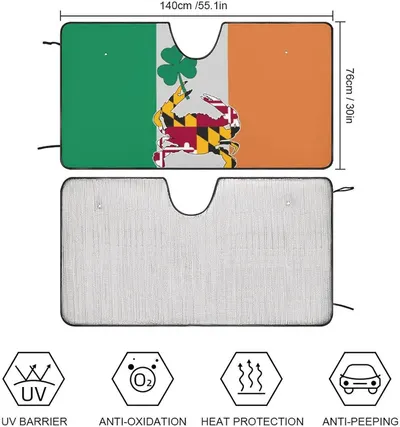 Maryland Shamrock Irish Flag Windshield Sun Shade Foldable Reflective Sun Shade Blocks…
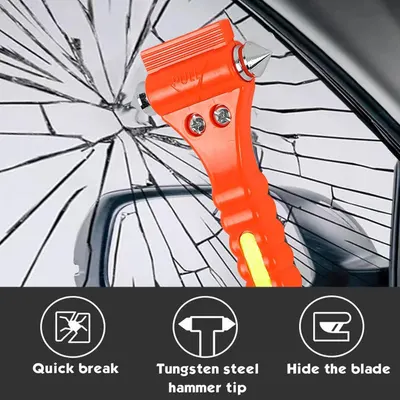 MorTime 6 Pack Car Safety Hammer Window Breaker
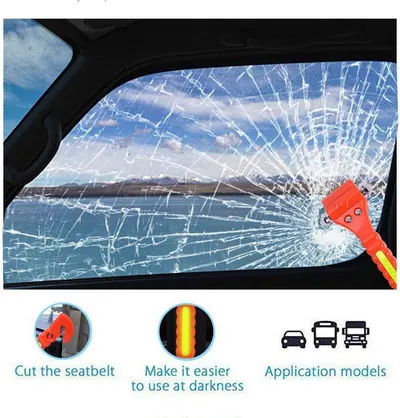 4 PCS GoDeCho Car Emergency Escape Window Breaker and Seat Belt Cutter Hammer with Light…
 Drift Car Air Freshener
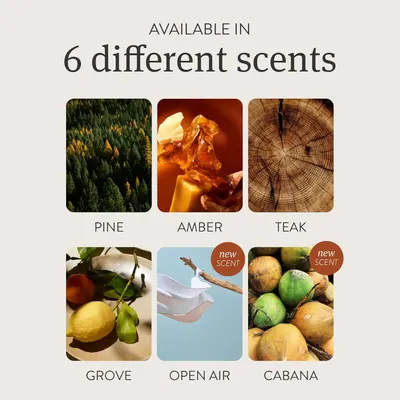 Drift Car Air FreshenerHoogaLife Car Air Freshener Diffuser 2 Pack Hanging Air Freshener Diffuser
 Car Air Freshener
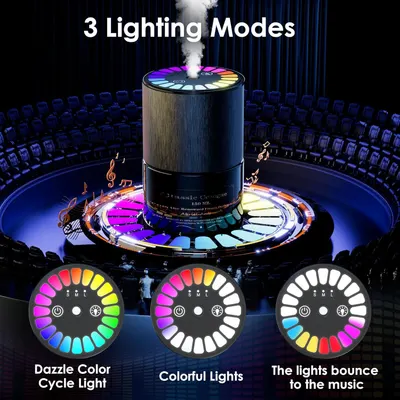 Car Air Freshener
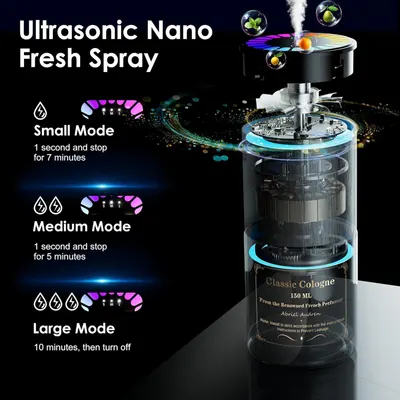 Car Air Freshener
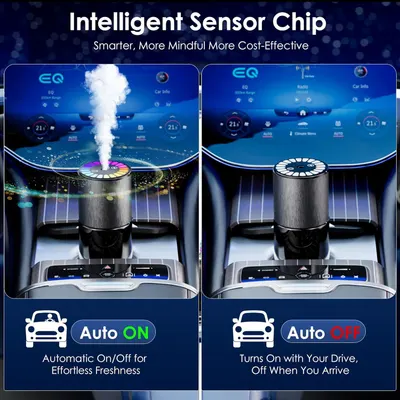 Car Air Freshener
 C Classy Car Air Freshener Hanging 2 Pack
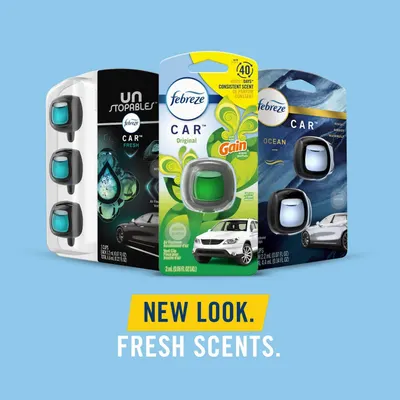 Febreze Car Vent Clip
 Febreze Car Vent Clip
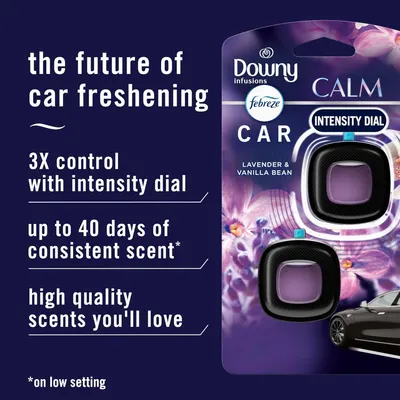 Febreze Car Vent Clip
 Febreze Car Air Freshener
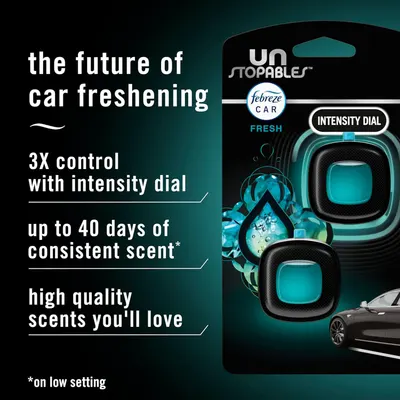 Febreze Car Air Freshener
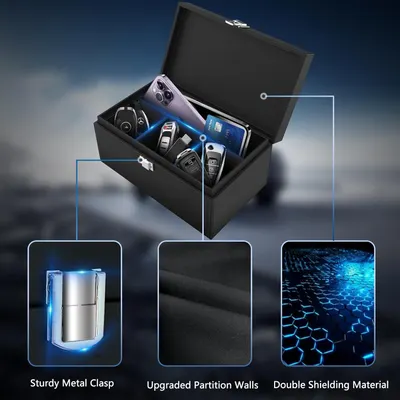 Faraday Box for Car Keys Extra Large 8.66 x 5.2 x 4.13 Inches
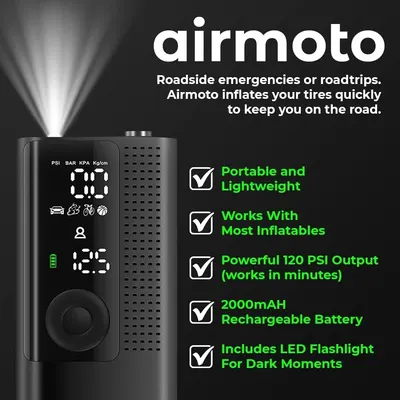 Airmoto Tire Inflator Portable Air Compressor
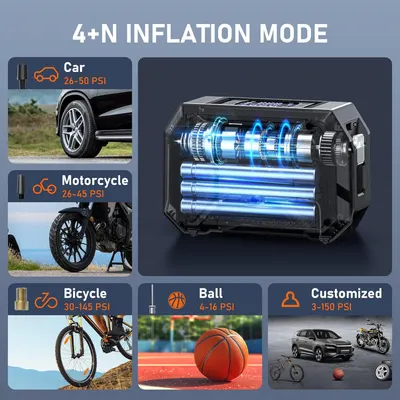 Tire Inflator Portable Air Compressor
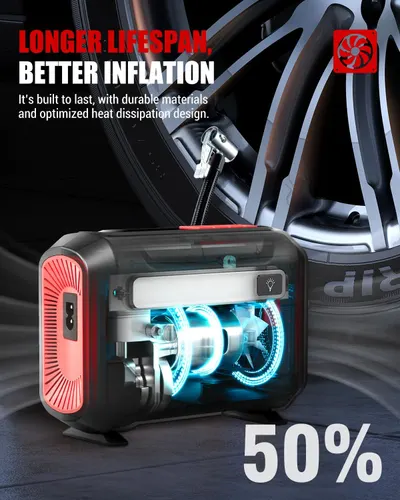 R8 Tire Inflator Portable Air Compressor
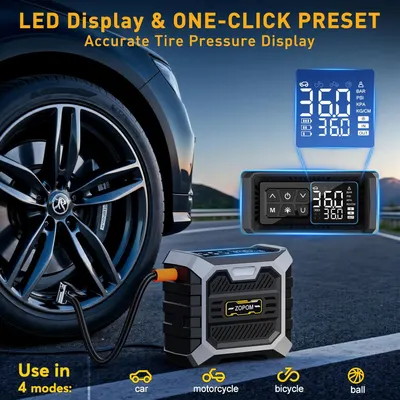 Tire Inflator Portable Air Compressor DC 12V Portable Air Compressor with Digital…
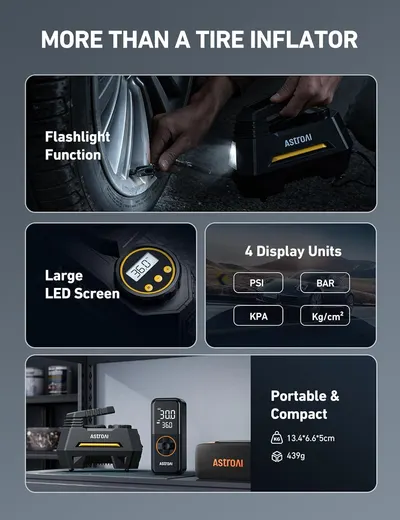 AstroAI Tire Inflator Portable Air Compressor Air Pump for Car Tires-Car Accessories
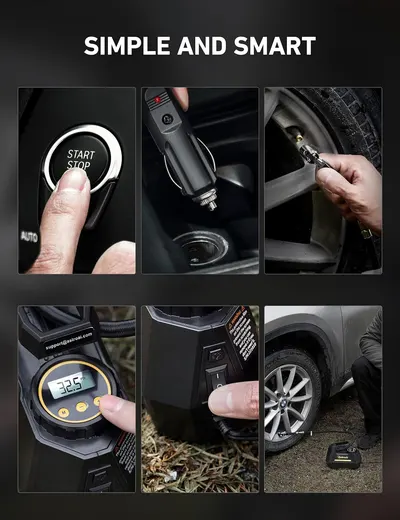 AstroAI Tire Inflator Portable Air Compressor Air Pump for Car Tires-Car Accessories
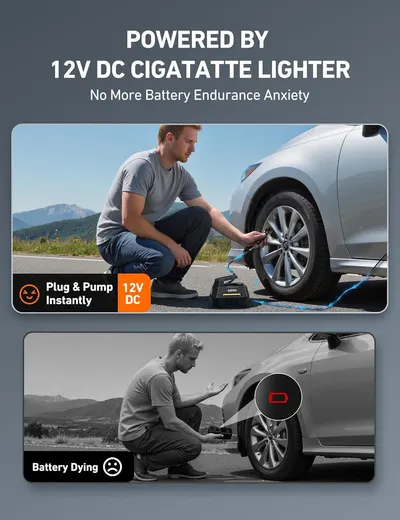 AstroAI Tire Inflator Portable Air Compressor Air Pump for Car Tires-Car Accessories
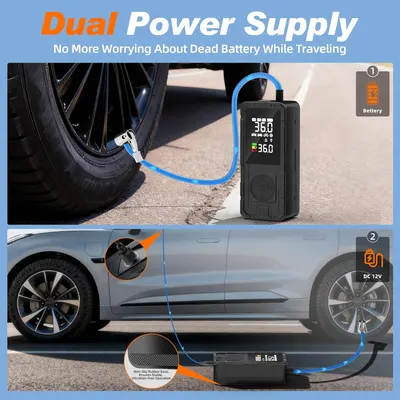 P10 Portable Air Compressor
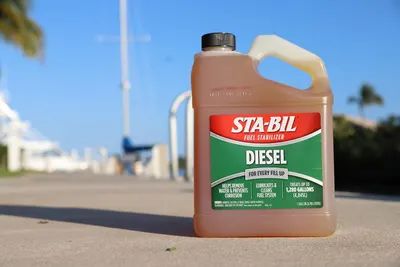 STA-BIL (22255) Diesel Fuel Stabilizer And Performance ImproverSTA-BIL (22255) Diesel Fuel Stabilizer And Performance Improver
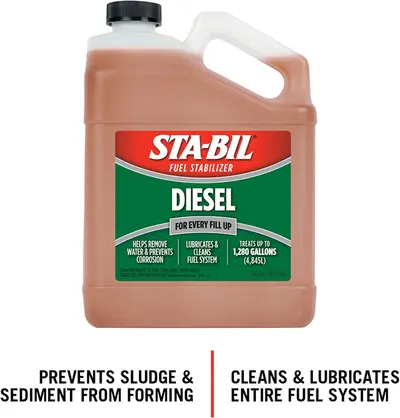 STA-BIL (22255) Diesel Fuel Stabilizer And Performance Improver
Where infographic images sit in Automotive listings
| Image number | Examples | Share |
|---|---|---|
| Image 2 | 38 | 24% |
| Image 3 | 27 | 17% |
| Image 4 | 22 | 14% |
| Image 5 | 24 | 15% |
| Image 6 | 21 | 13% |
| Image 7 | 11 | 7% |
| Image 8 | 13 | 8% |
| Image 9 | 3 | 2% |
Common design themes
- High Quality8
- Machine Washable8
- Lint Free7
- Scratch Free7
- Durability6
- Easy to Use6
- Effective Cleaning6
- Highly Absorbent6
More Automotive image types
- Secondary Images1,034
- Single Benefit Images315
- Main Images183
- Use Case Images143
- Product Main Images138
- How to Use Images119
- What's in the Box Images65
- Key Stat Images59
- Dimension Images59
- Main Images with Accessories56
- Main Images with Packaging46
- Product Detail Images46
- Safety / Compatibility Images44
- Premium A+ Modules41
- Before and After Images34
- Comparison Chart Images33
- Brand Images30
- Main Images with Variants25
- Lifestyle Images25
- Single Benefit A+ Modules18
- Infographic A+ Modules17
- Seasonal Images15
Infographic Images in other categories
- Health & Household992
- Beauty & Personal Care899
- Electronics757
- Home & Kitchen644
- Sports & Outdoors611
- Tools & Home Improvement447
- Musical Instruments380
- Pet Supplies301
- Office Products255
- Grocery & Gourmet Food253
- Toys & Games225
- Arts, Crafts & Sewing207
- Clothing, Shoes & Jewelry171
- Baby Products168
- Patio, Lawn & Garden162
- Industrial & Scientific112
- Cell Phones & Accessories100
- Appliances98
- Video Games69
Automotive listings with full image stacks
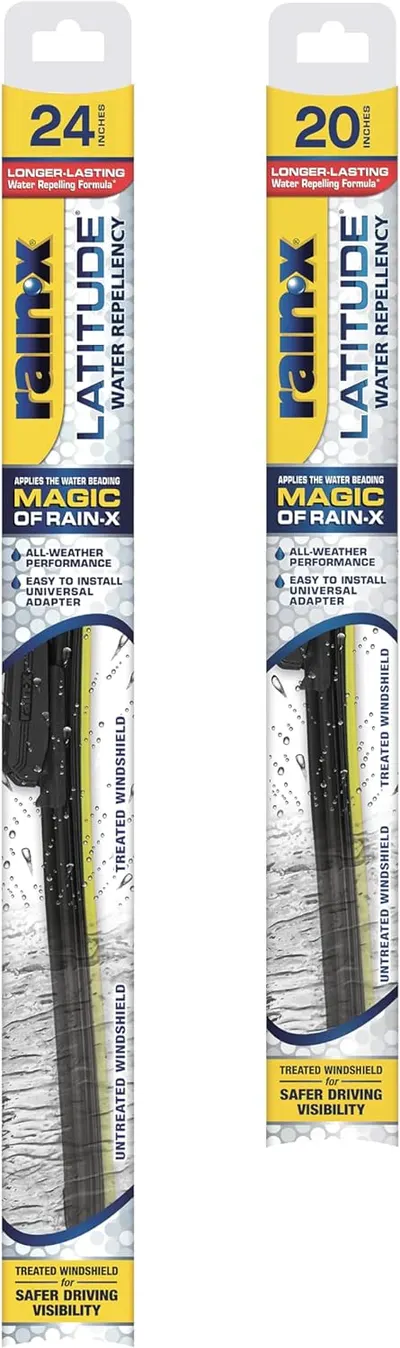 Rain-X 810162 Latitude 2-In-1 Water Repellent Wiper Blades9 gallery images · #2 in Automotive
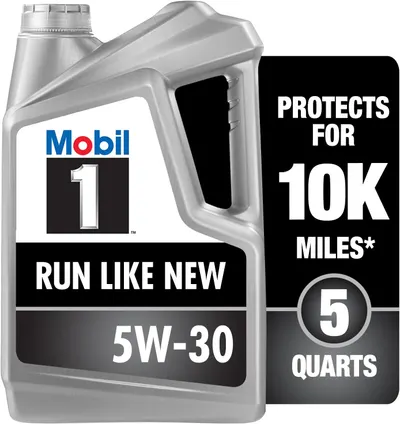 Mobil 1 Advanced Full Synthetic Motor Oil 5W-308 gallery images · #3 in Automotive
 USANOOKS Microfiber Cleaning Cloth Grey8 gallery images · #6 in Automotive
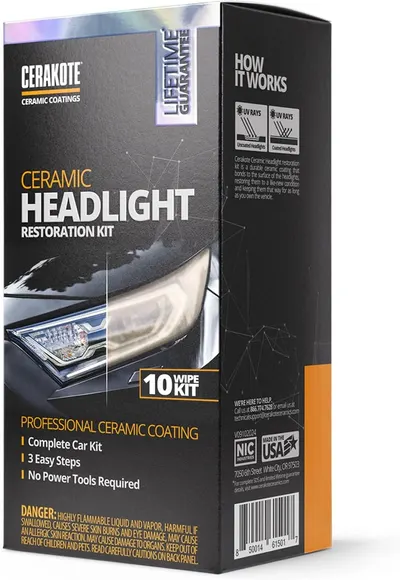 CERAKOTE® Ceramic Headlight Restoration Kit9 gallery images · #8 in Automotive
 AIDEA Microfiber Cleaning Cloth Black 10PK7 gallery images · #11 in Automotive
 AIDEA Microfiber Cleaning Cloth7 gallery images · #11 in Automotive
 AIDEA Microfiber Cleaning Cloth 20PK7 gallery images · #11 in Automotive
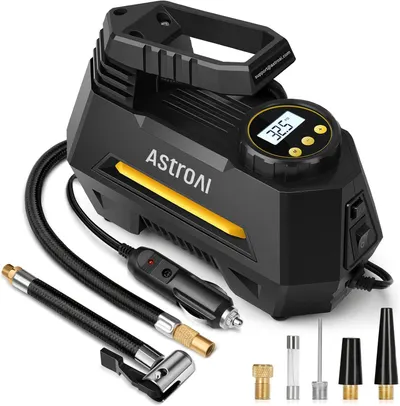 AstroAI AIRUN H Tire Inflator Portable Air Compressor Air Pump for…9 gallery images · #28 in Automotive
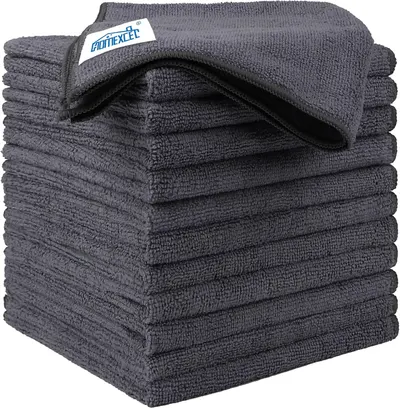 HOMEXCEL Microfiber Cleaning Cloth 12 Pack7 gallery images · #28 in Automotive
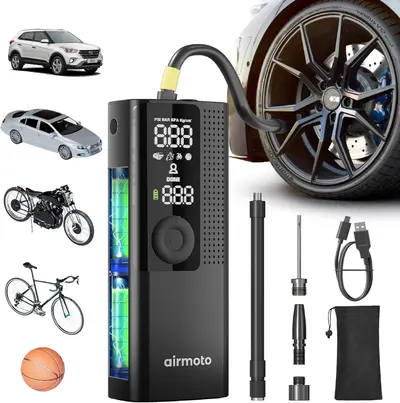 Airmoto Tire Inflator Portable Air Compressor9 gallery images · #35 in Automotive
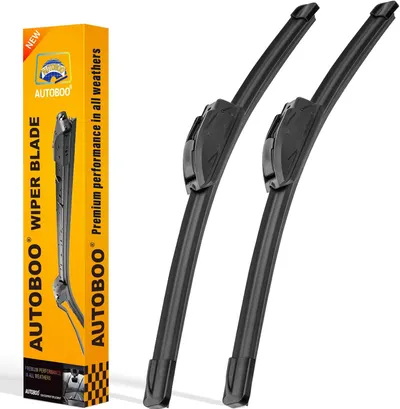 AUTOBOO 26" and 18" Windshield Wipers Blades (Pack Of 2)8 gallery images · #35 in Automotive
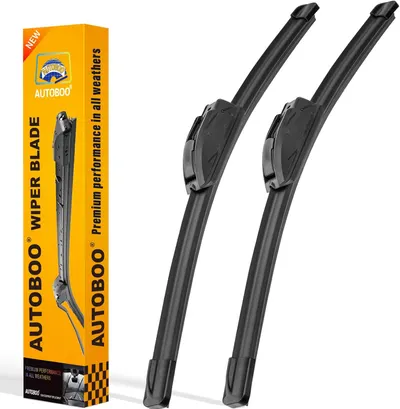 AUTOBOO 26" and 16" Windshield Wipers Blades (Pack Of 2)8 gallery images · #35 in Automotive
Automotive brands using infographic images
Automotive product niches
- Portable Jump Box78
- Car Cleaning Wipes71
- Microfiber Cleaning Cloth142
- Car Air Freshener149
- Tire Air Compressor85
- Fuel Stabilizer65
- Headlight Restoration Kit81
- Windshield Cleaner Tool76
- Windshield Wiper Blades76
- Cup Holder Insert64
- Motor Oil73
- Window Breaker Seatbelt Cutter70
Our design team makes Amazon listing images, infographics and A+ content. £750 per day, with revisions the next day.
Last example added 2026-09-22 · 160 examples. Image types are tagged by AI and checked by hand in samples.