Paper Amazon listing images
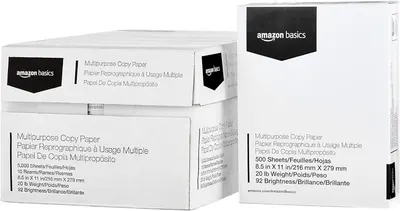
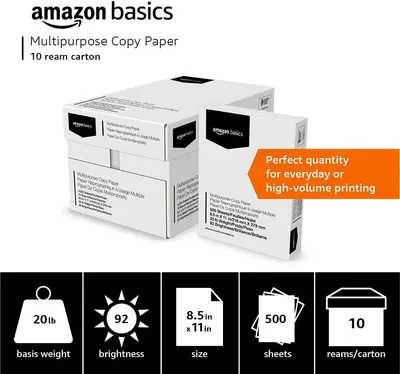
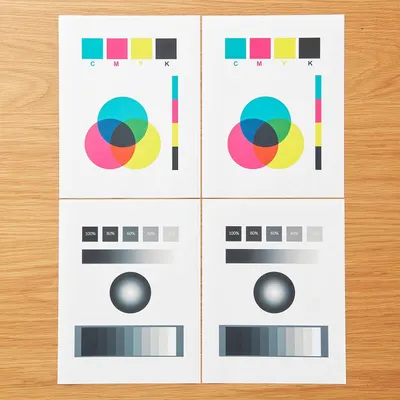
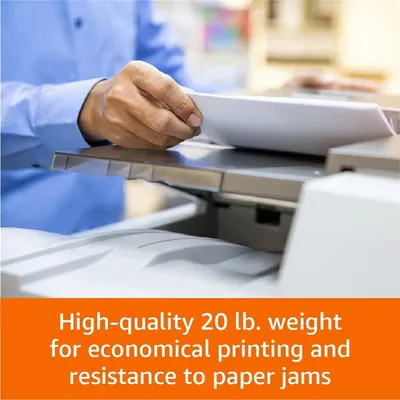
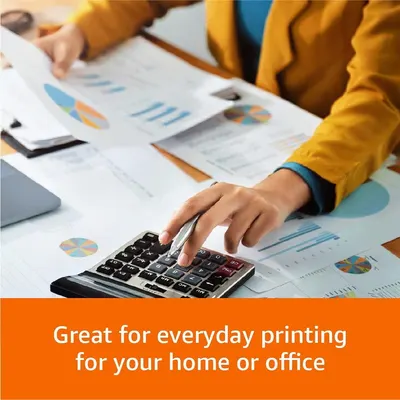
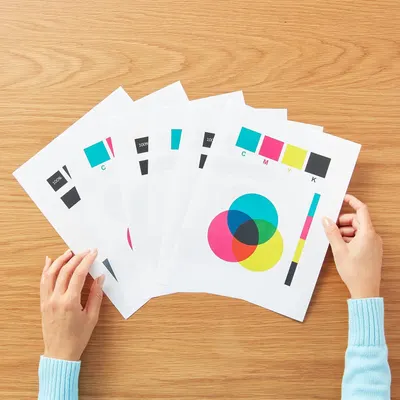
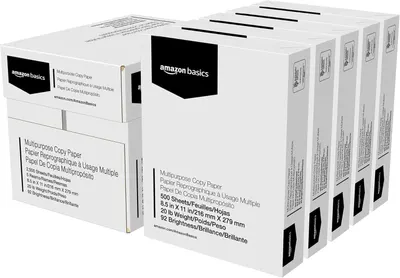
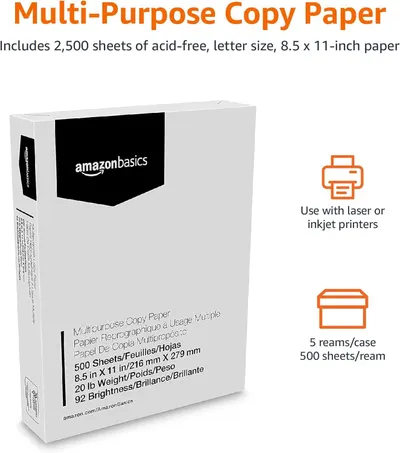
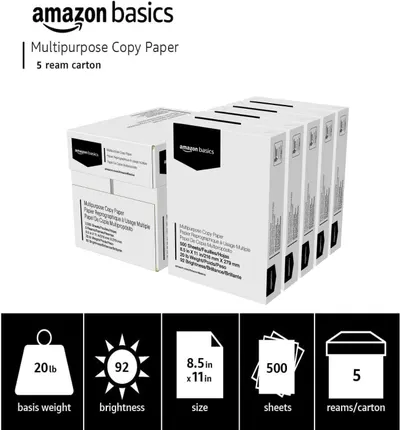
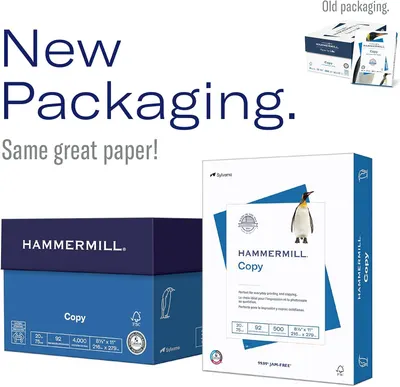
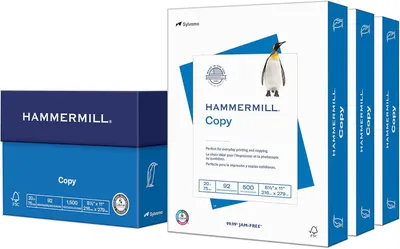
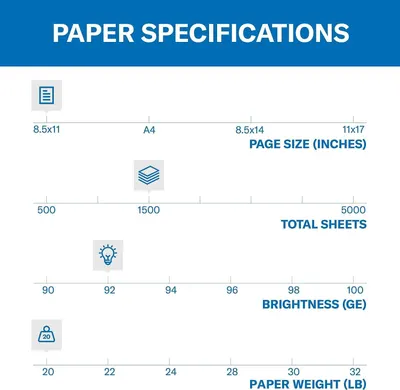
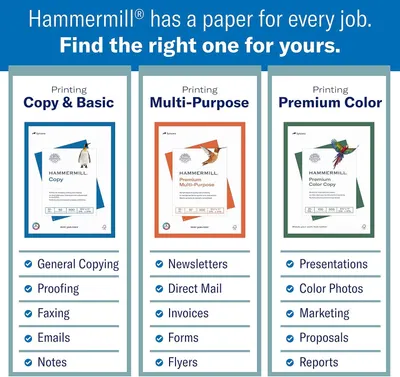
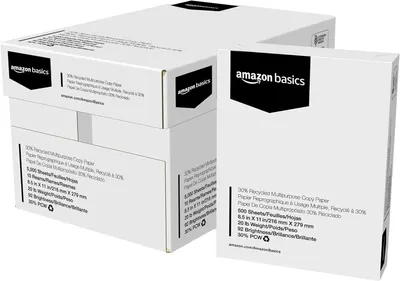
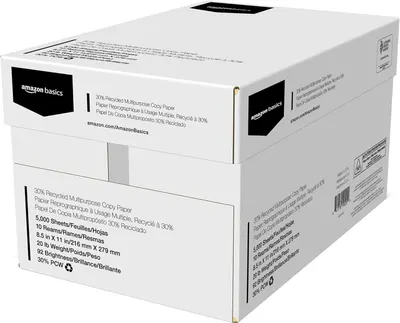
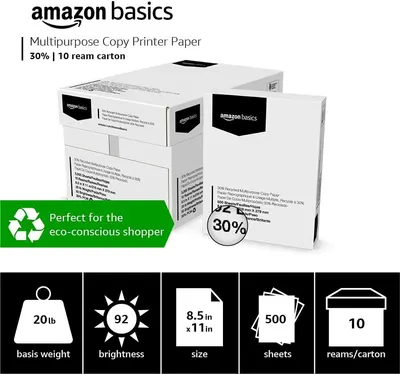
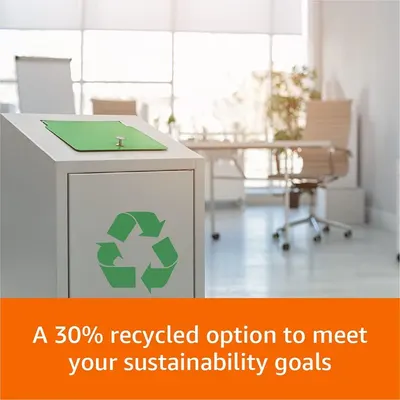
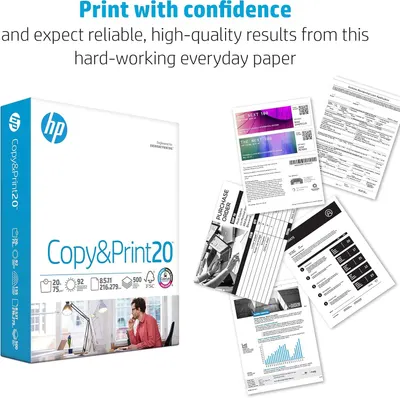
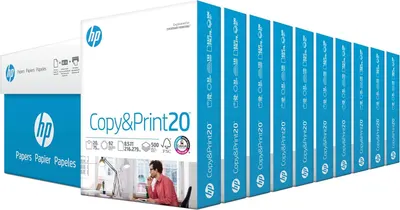
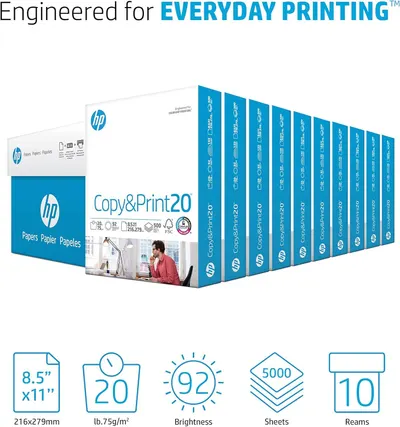
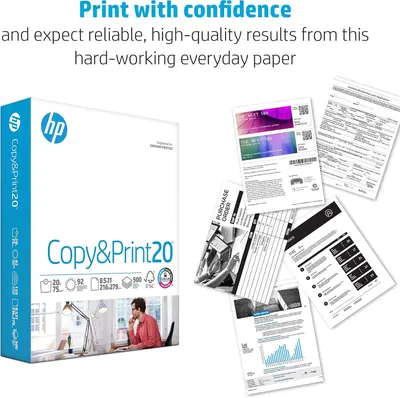
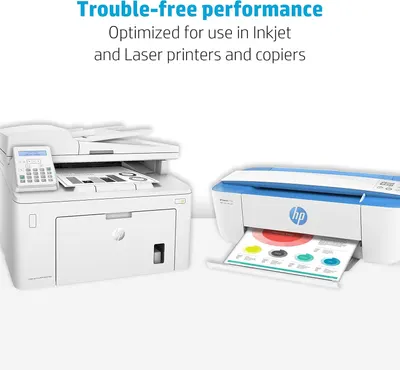
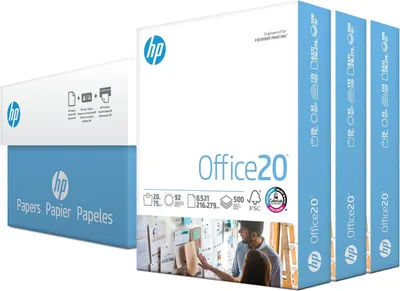
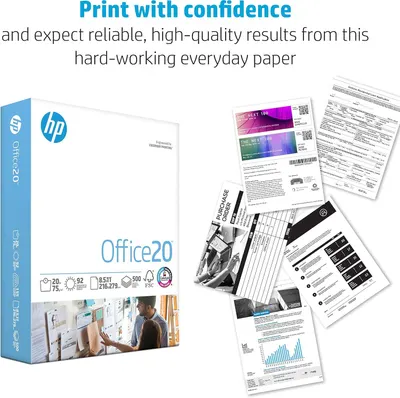
We have 62 listing images from 9 Paper listings on Amazon in Office Products. The most common pattern: main images with packaging in image 1, infographic images in images 2 to 3, single benefit images in image 4 and before and after images in image 5. Main Images with Packaging make up 15% of these images, 7.1× the library average.
See your listing next to your competitors
Paste your Amazon link. We score every image and show what the top sellers do differently. Your first comparison is free.
Every Paper listing, image by image
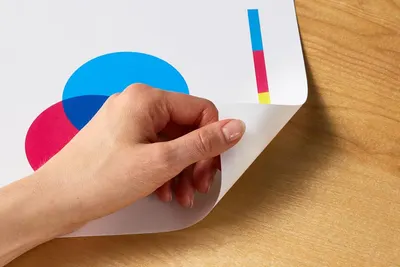
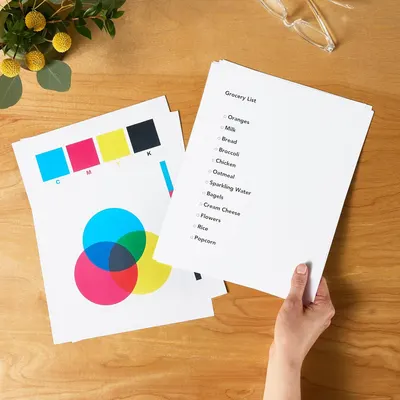
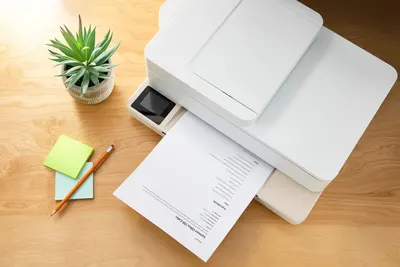
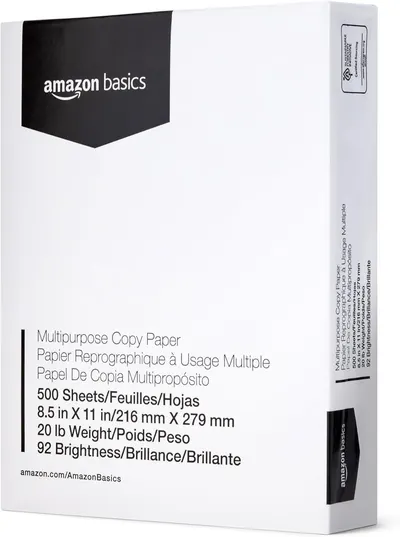
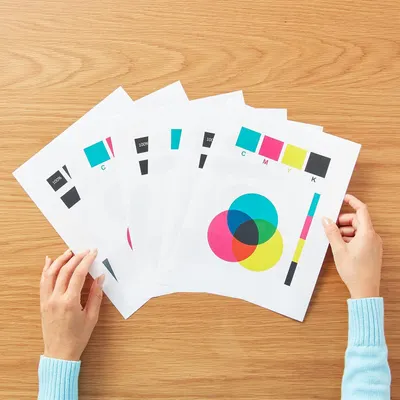
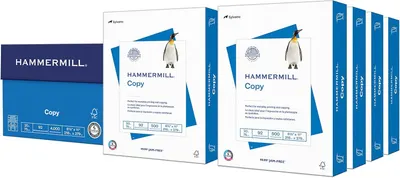
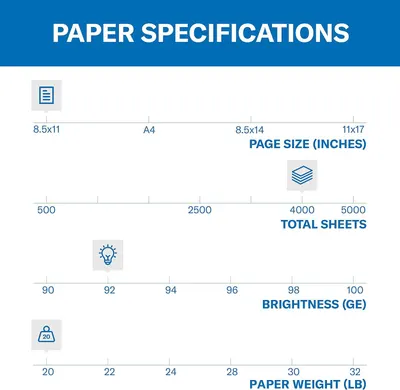
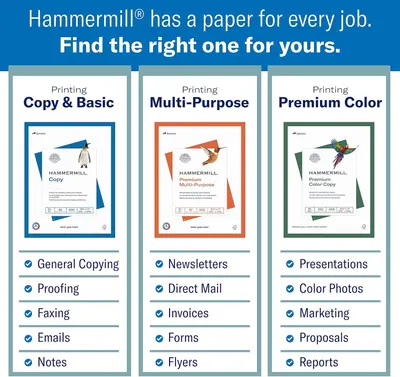
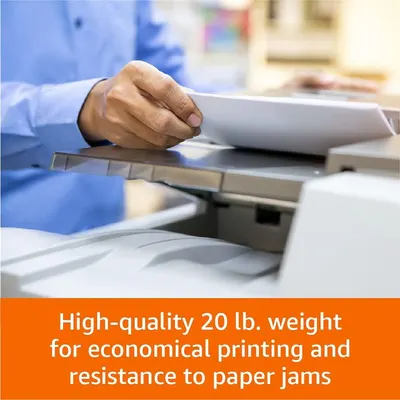
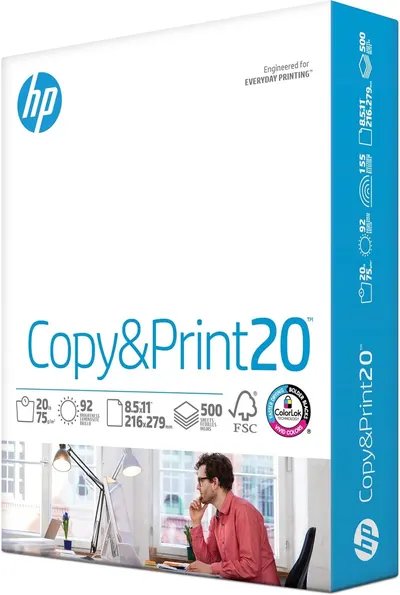
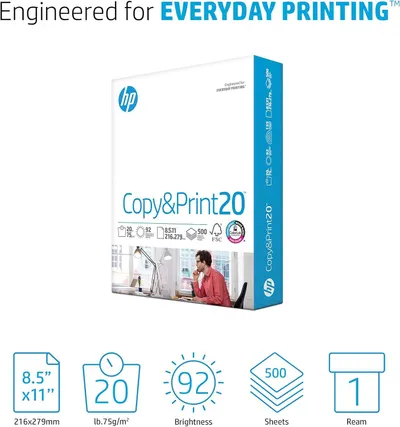
Brands vs the paper leaders
Hero, gallery and A+ images side by side, with readability scores and best-seller ranks.
- Listings
- 9
- Images
- 62
- Full image stacks
- 6
- Categories
- Office Products
- Top themes
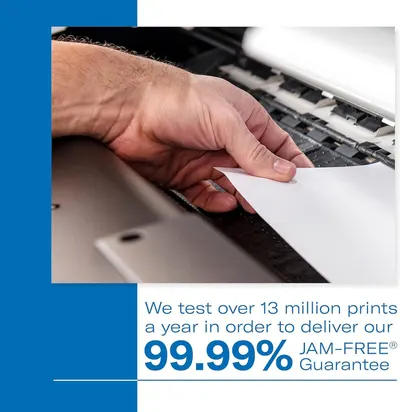
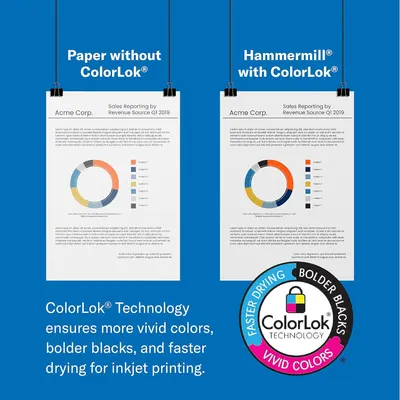
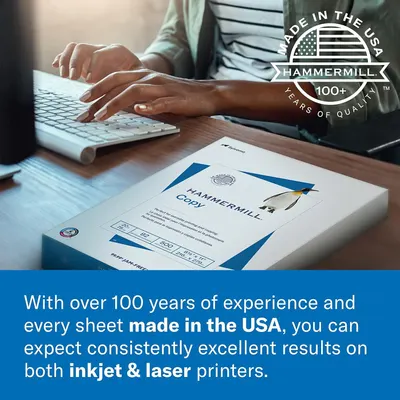
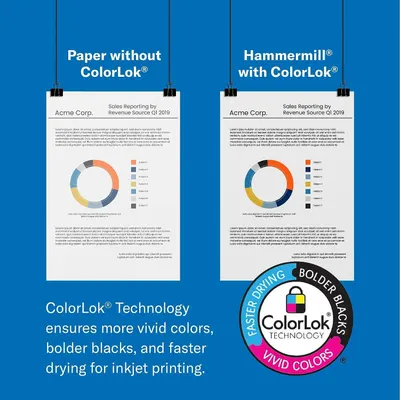
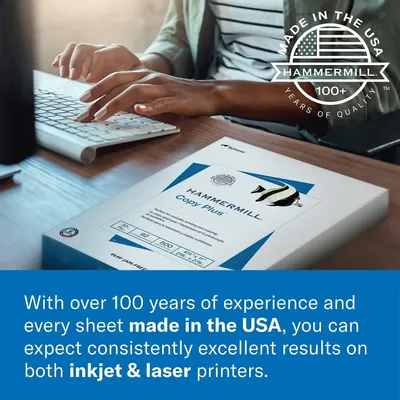
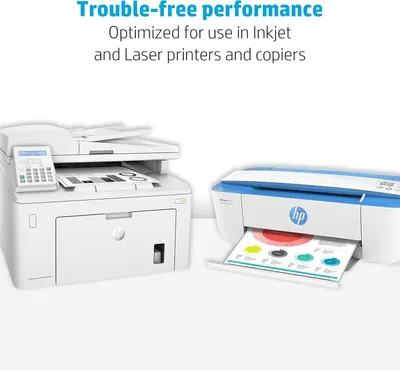
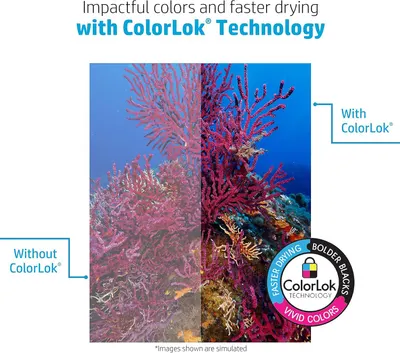
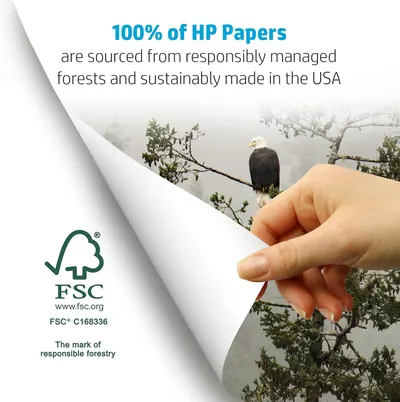
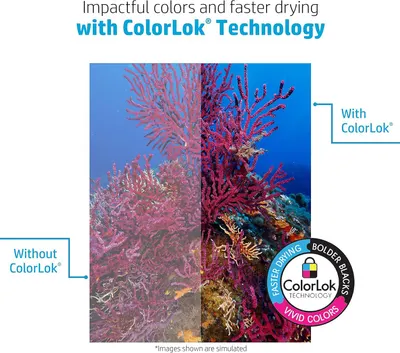
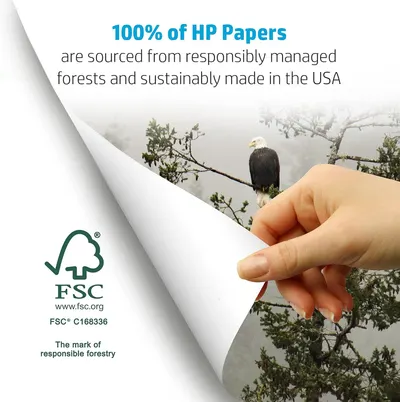
- ColorLok Technology, Faster Drying, Made in USA, Printer Compatibility
The typical Paper image stack
| Image | Most common type | Share of listings |
|---|---|---|
| 1 | Main Images with Packaging | 100% of 9 |
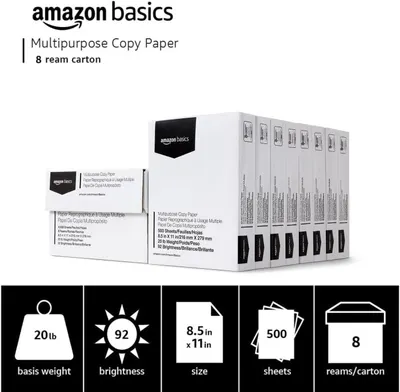
| 2 | Infographic Images | 67% of 9 |
| 3 | Infographic Images | 56% of 9 |
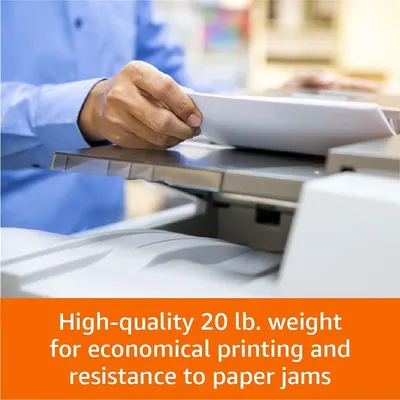
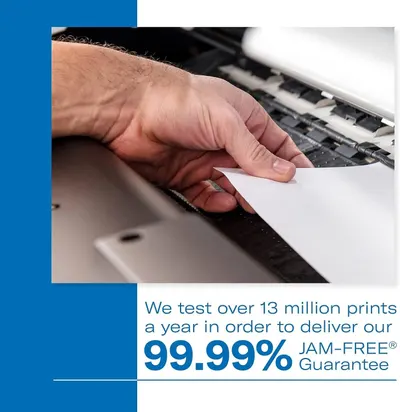
| 4 | Single Benefit Images | 33% of 9 |
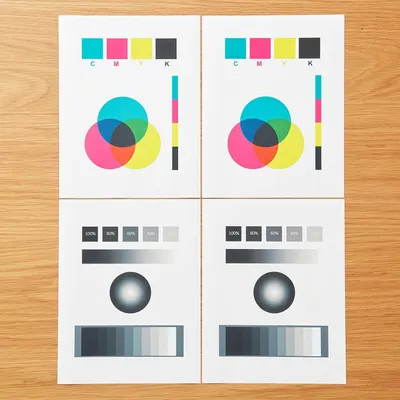
| 5 | Before and After Images | 33% of 9 |
| 6 | Single Benefit Images | 44% of 9 |
| 7 | Brand Images | 33% of 6 |
Image types sellers use most
| Image type | Images | Share | vs library |
|---|---|---|---|
| Single Benefit Images | 11 | 18% | 1.4× |
| Infographic Images | 11 | 18% | 2.2× |
| Main Images with Packaging | 9 | 15% | 7.1× |
| Safety / Compatibility Images | 9 | 15% | 7.1× |
| Brand Images | 7 | 11% | 4.1× |
| Product Main Images | 7 | 11% | 1.6× |
| Use Case Images | 5 | 8% | 1.9× |
| White Background Images | 5 | 8% | 3.2× |
| Lifestyle Images | 4 | 6% | 0.3× |
| Before and After Images | 3 | 5% | 7.6× |
Common design themes
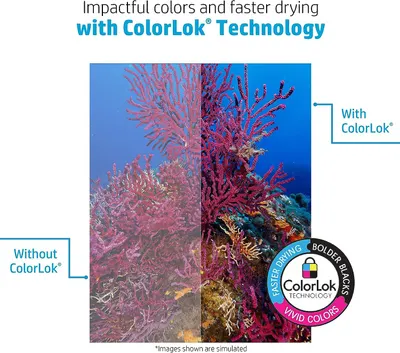
- ColorLok Technology5
- Faster Drying5
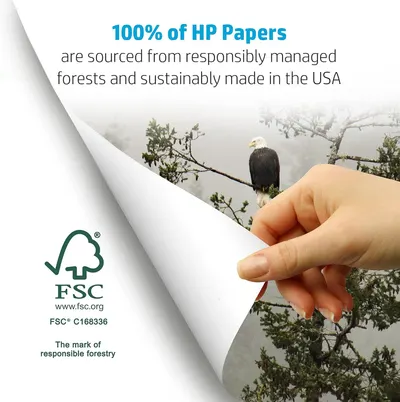
- Made in USA5
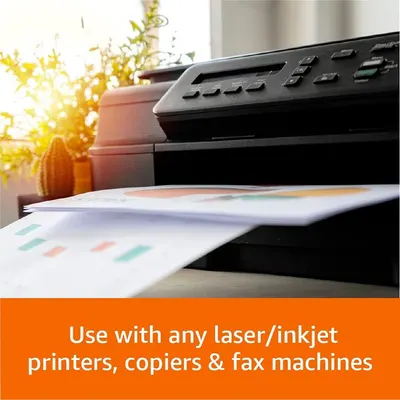
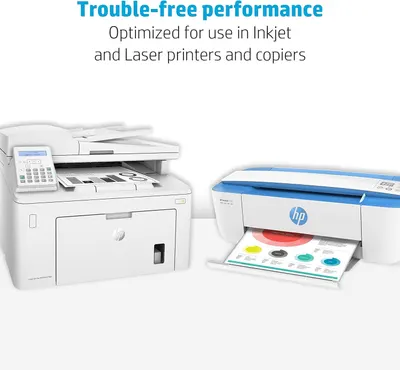
- Printer Compatibility5
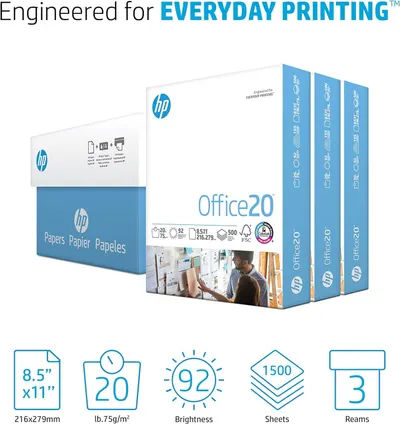
- Brightness4
- Sheet Count4
- Trouble-free Performance4
- Bolder Blacks3
Brands selling Paper
Our design team makes Amazon listing images, infographics and A+ content. £750 per day, with revisions the next day.
Last example added 2026-02-26 · 62 images. Image types are tagged by AI and checked by hand in samples.
These images belong to their brand owners and are shown for design research. Request removal.