Infographic A+ Module Examples for Health & Household
We have 255 infographic A+ module examples from 117 Health & Household listings on Amazon. They make up 2% of Health & Household images, against 2% across the library. Common themes: Feature Grid, Ingredient Breakdown and Product Benefits.
- Examples
- 255
- Listings
- 117
- Share of Health & Household images
- 2%
- All examples
- Infographic A+ Modules · Health & Household
The best infographic A+ module examples for Health & Household
Ranked by a score built from what the image does at a glance: how big and how readable its message is, measured, plus a design judgement. 254 images in this collection are scored.
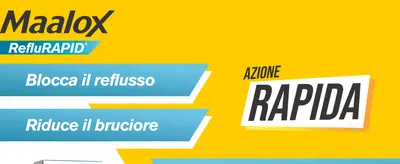 Maalox Reflurapid blocca il Reflusso e riduce il Bruciore88Reads at a glance
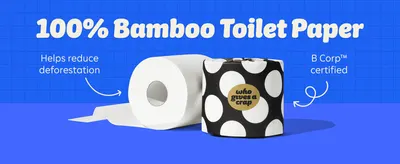 Who Gives A Crap 100% Bamboo Toilet Paper87Reads at a glance
 Eco Soul Premium Bamboo Toilet Paper 3 Ply87Reads at a glance
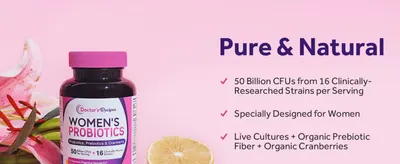 Doctor's Recipes Women’s Probiotic87Reads at a glance
 Mucinex Sinus Saline Nasal Spray & Sinus Rinse77Readable
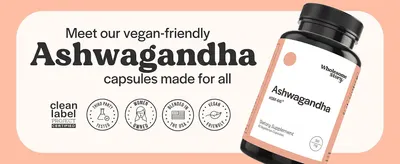 Vegan KSM 66 Ashwagandha Capsules| High Potency 5% Withanolides77Readable
 ForestLeaf Collagen Supplements for Women & Men Types I/II/III76Readable
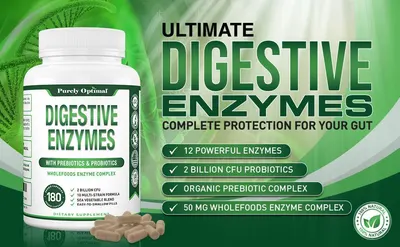 Purely Optimal Digestive Enzymes73Readable
 SAGA Organic Sleep Shots70Readable
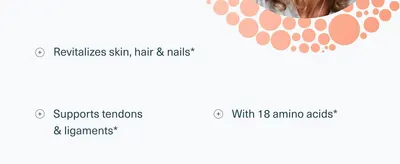 Youtheory Advanced Collagen70Readable
 Ancient Nutrition Hydrolyzed Multi Collagen Peptides Capsules70Readable
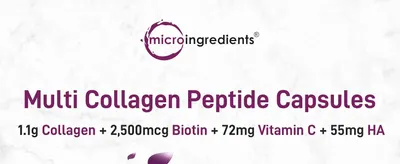 Micro Ingredients Multi Collagen Peptides Pills70Readable
| Measured | Best 25 | The rest | Accessibility floor |
|---|---|---|---|
| Headline height, % of image | 11.3% | 7.6% | 6.5% on a search tile |
| Headline contrast | Lc 77 | Lc 63 | Lc 45 minimum, 60 preferred |
| Text area, % of image | 15.5% | 14.5% | — |
| Separate blocks of text | 7 | 12 | — |
| Headline set bold | 36% | 31% | — |
| Still readable blurred to tile size | 36% | 4% | — |
Measured on 249 images with OCR: text height as a share of the image, APCA contrast against what sits behind the text, and whether the headline can still be read once the image is blurred to the size a shopper sees in search.
Every example
 We-Vibe Nova 2 Dual Rabbit Vibrator for Women
 plusOne Dual Rabbit Vibrator
 Healing Crystal Candle Gift Set
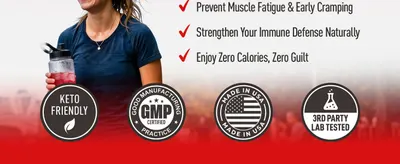 PowderVitamin Electrolytes Powder Plus
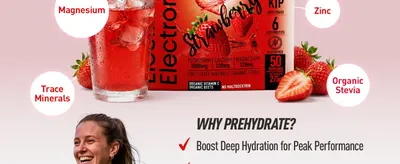 PowderVitamin Electrolytes Powder Plus
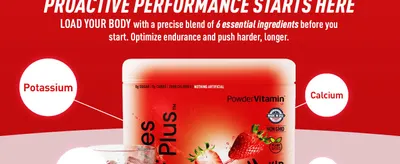 PowderVitamin Electrolytes Powder Plus
 natural elements Whey Protein Pulver Neutral 1kg
 natural elements Whey Protein Pulver Neutral 1kg
 natural elements Whey Protein Pulver Neutral 1kg
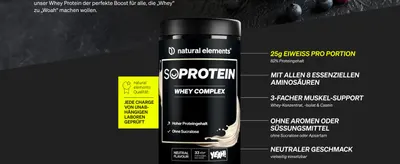 natural elements Whey Protein Pulver Neutral 1kg
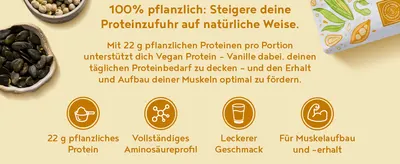 Alpha Foods Vegan Protein Pulver
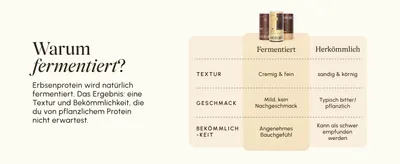 VETAIN Veganes Proteinpulver Vanille
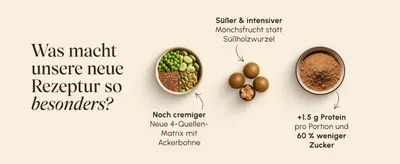 VETAIN Veganes Proteinpulver Vanille
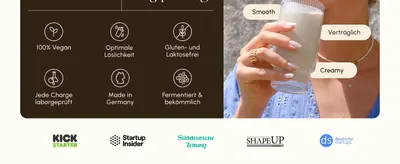 VETAIN Veganes Proteinpulver Vanille
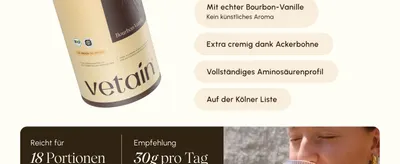 VETAIN Veganes Proteinpulver Vanille
 VETAIN Veganes Proteinpulver Vanille
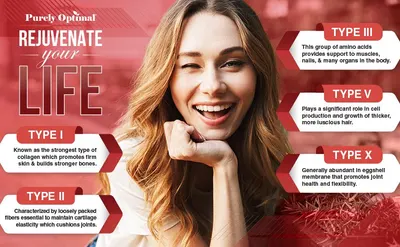 Purely Optimal Premium Multi Collagen Peptides Capsules (Types I
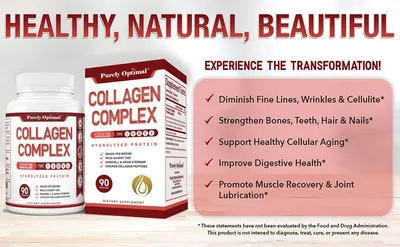 Purely Optimal Premium Multi Collagen Peptides Capsules (Types I
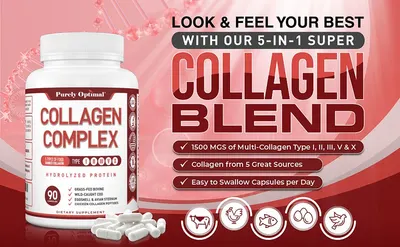 Purely Optimal Premium Multi Collagen Peptides Capsules (Types I
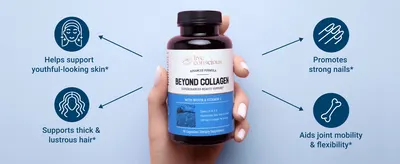 Live Conscious Beyond Collagen Multi Collagen Capsules
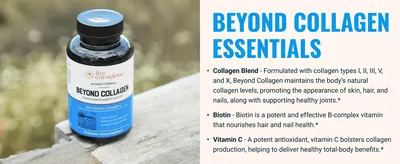 Live Conscious Beyond Collagen Multi Collagen Capsules
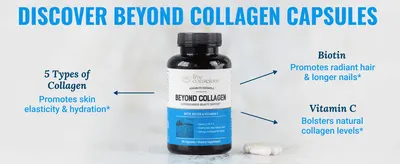 Live Conscious Beyond Collagen Multi Collagen Capsules
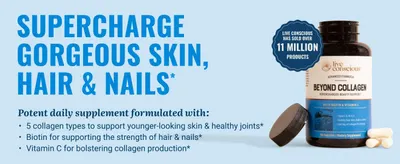 Live Conscious Beyond Collagen Multi Collagen Capsules
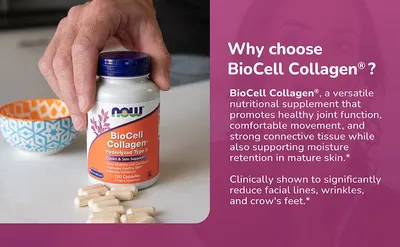 NOW Supplements
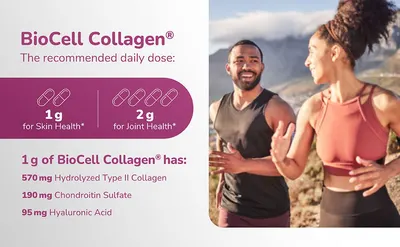 NOW Supplements
 NOW SupplementsForestLeaf Collagen Supplements for Women & Men Types I/II/III
 ForestLeaf Collagen Supplements for Women & Men Types I/II/III
 ForestLeaf Collagen Supplements for Women & Men Types I/II/III
 ForestLeaf Collagen Supplements for Women & Men Types I/II/III
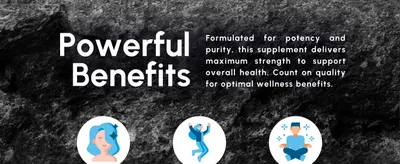 ForestLeaf Collagen Supplements for Women & Men Types I/II/III
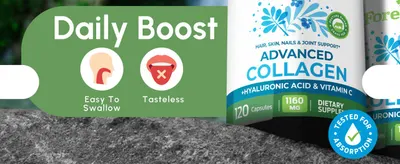 ForestLeaf Collagen Supplements for Women & Men Types I/II/III
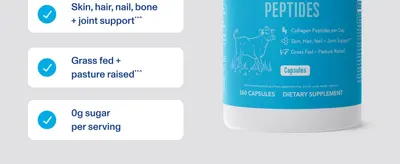 Vital Proteins Collagen Peptides Capsules for WomenYoutheory Advanced Collagen
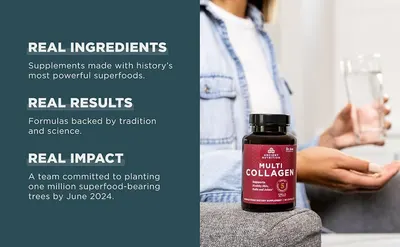 Ancient Nutrition Hydrolyzed Multi Collagen Peptides CapsulesAncient Nutrition Hydrolyzed Multi Collagen Peptides Capsules
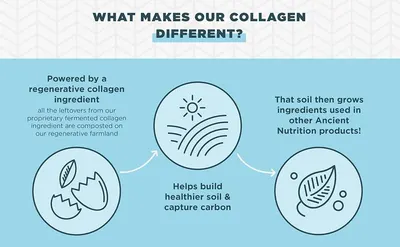 Ancient Nutrition Hydrolyzed Multi Collagen Peptides Capsules
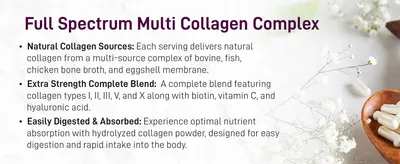 Micro Ingredients Multi Collagen Peptides Pills
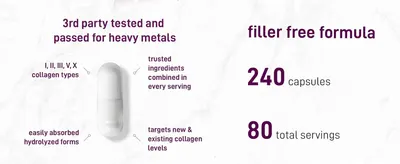 Micro Ingredients Multi Collagen Peptides Pills
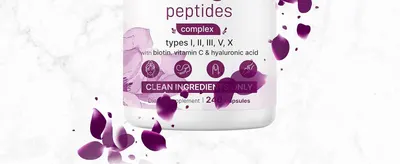 Micro Ingredients Multi Collagen Peptides PillsMicro Ingredients Multi Collagen Peptides Pills
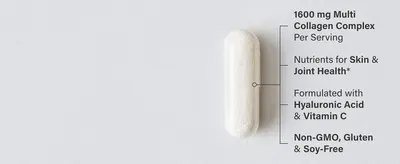 Sports Research® Multi Collagen Peptides w/Hyaluronic Acid
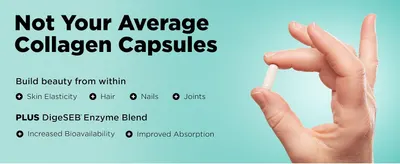 Vital Vitamins Multi Collagen Peptides Complex for Women & Men
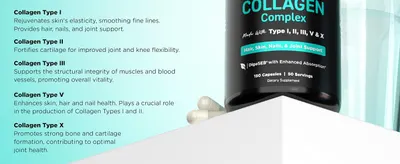 Vital Vitamins Multi Collagen Peptides Complex for Women & Men
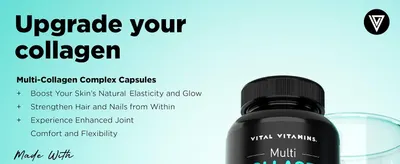 Vital Vitamins Multi Collagen Peptides Complex for Women & Men
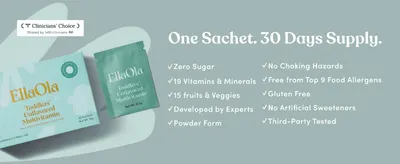 ELLAOLA Toddler Multivitamin Powder
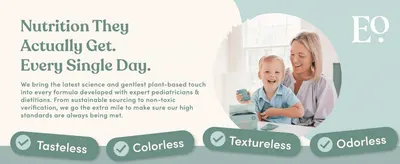 ELLAOLA Toddler Multivitamin Powder
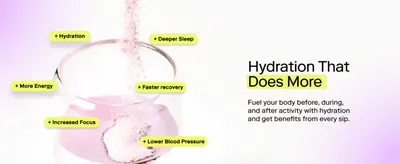 MAGNA Electrolyte Powder Drink Mix for Hydration
Common design themes
- Feature Grid17
- Ingredient Breakdown14
- Product Benefits9
- Product Features9
- Ingredient Benefits Grid8
- Feature List7
- Quality Certifications7
- Multiple Benefits6
More Health & Household image types
- Secondary Images7,416
- Lifestyle Images5,303
- Main Images1,116
- Infographic Images992
- Single Benefit Images929
- Premium A+ Modules679
- Product Main Images647
- Basic A+ Content570
- Brand Story372
- Brand Images346
- Premium A+ Content323
- Main Images with Packaging320
- How to Use Images314
- Use Case Images266
- Safety / Compatibility Images261
- Brand Store239
- Single Benefit A+ Modules223
- Product Detail Images221
- Key Stat Images216
- What's in the Box Images182
- Brand A+ Modules168
- Comparison Chart Images161
- Dimension Images145
- UGC Images93
- Sponsored Brands Ads90
- White Background Images89
- Safety / Compatibility A+ Modules63
- Main Images with Graphics50
- How to Use A+ Modules43
- A+ Modules43
- Key Stat A+ Modules42
- Main Images with Accessories41
- Main Images with Variants41
- Before and After Images40
- Lifestyle A+ Modules36
- Review Images35
- Product Detail A+ Modules31
- Comparison Chart A+ Modules22
- Shadow Main Images22
- Product Videos21
- Review A+ Modules18
- As Seen On Images18
- In-Use Main Images15
- Seasonal Images14
- Main Images with a Model13
- Use Case A+ Modules13
- Which One Is Right Images13
Infographic A+ Modules in other categories
- Home & Kitchen224
- Beauty & Personal Care187
- Clothing, Shoes & Jewelry96
- Pet Supplies96
- Grocery & Gourmet Food83
- Baby Products63
- Sports & Outdoors39
- Electronics37
- Patio, Lawn & Garden28
- Tools & Home Improvement19
- Automotive17
- Musical Instruments13
Health & Household listings with full image stacks
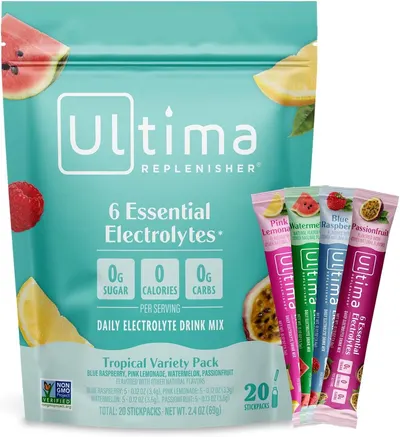 Ultima Replenisher Daily Electrolyte Powder8 gallery images · #48 in Health & Household
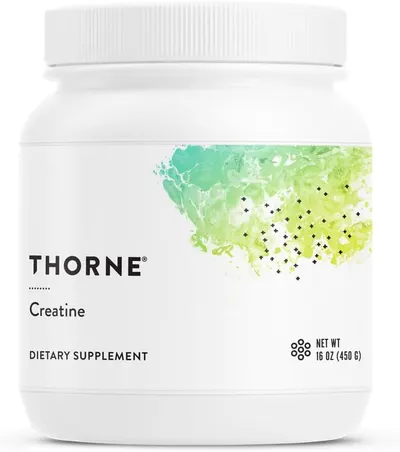 THORNE Creatine7 gallery images · #73 in Health & Household
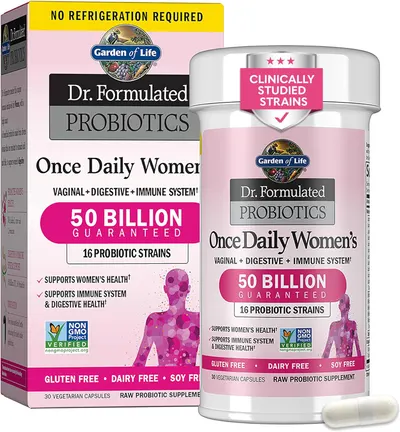 Garden of Life Once Daily Dr. Formulated Probiotics for Women 50…7 gallery images · #118 in Health & Household,
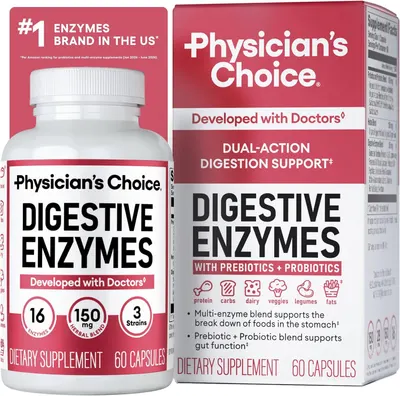 Physician's CHOICE Digestive Enzymes for Bloating & Digestion7 gallery images · #153 in Health & Household
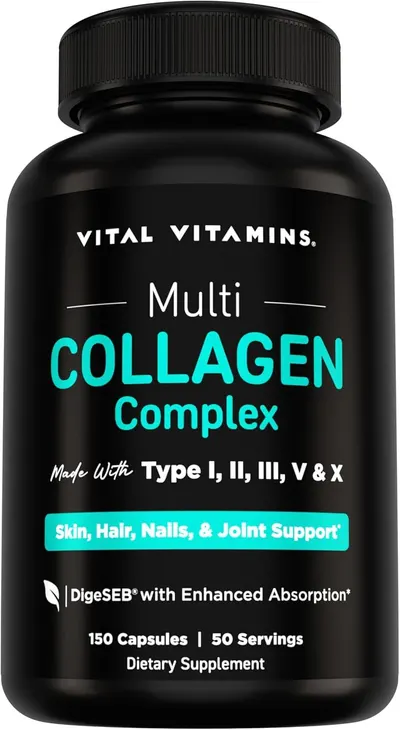 Vital Vitamins Multi Collagen Peptides Complex for Women & Men9 gallery images · #558 in Health & Household
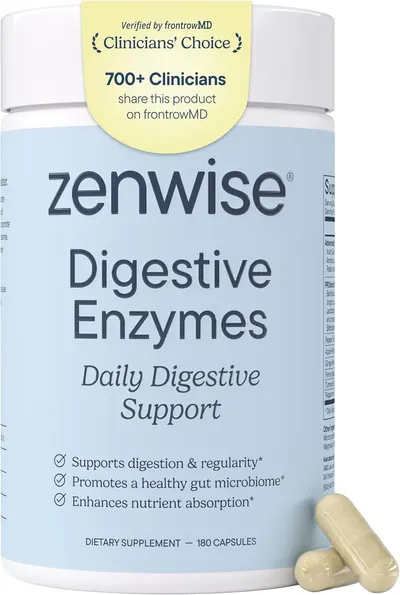 Zenwise Health Digestive Enzymes7 gallery images · #669 in Health & Household
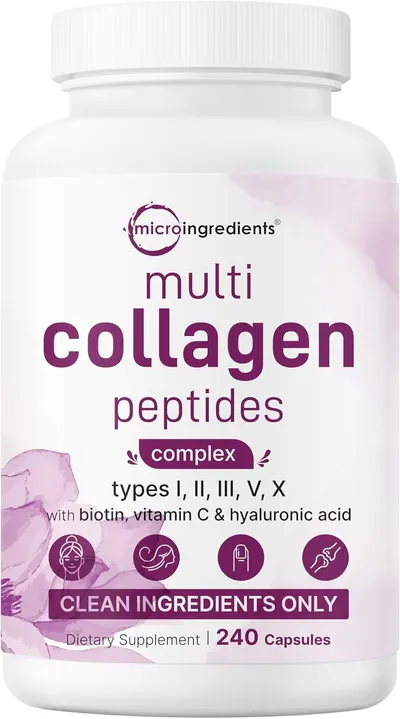 Micro Ingredients Multi Collagen Peptides Pills8 gallery images · #1,451 in Health & Household
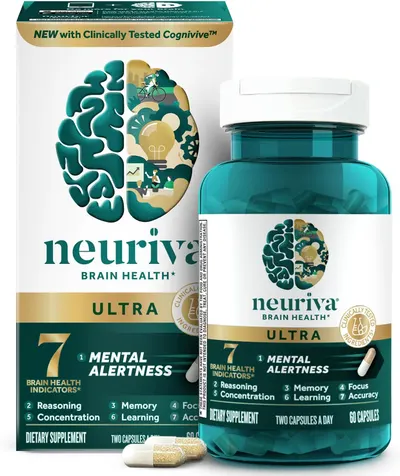 NEURIVA Ultra Decaffeinated Clinically Tested Nootropic Brain…12 gallery images · #2,204 in Health & Household
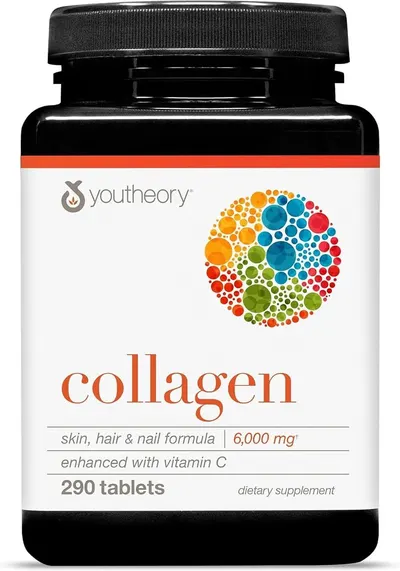 Youtheory Advanced Collagen9 gallery images · #2,262 in Health & Household
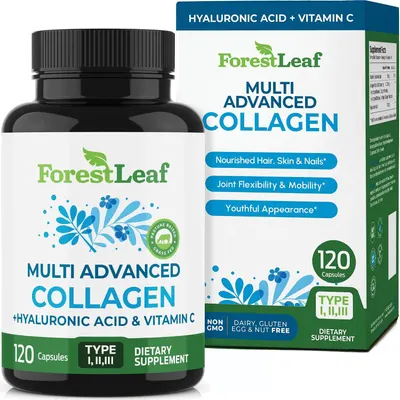 ForestLeaf Collagen Supplements for Women & Men Types I/II/III9 gallery images · #3,584 in Health & Household
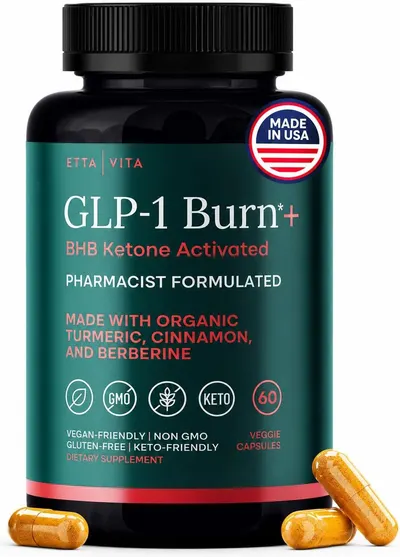 Ketosis & GLP-1 Supplement Weight Loss for Women and Men8 gallery images · #4,597 in Health & Household
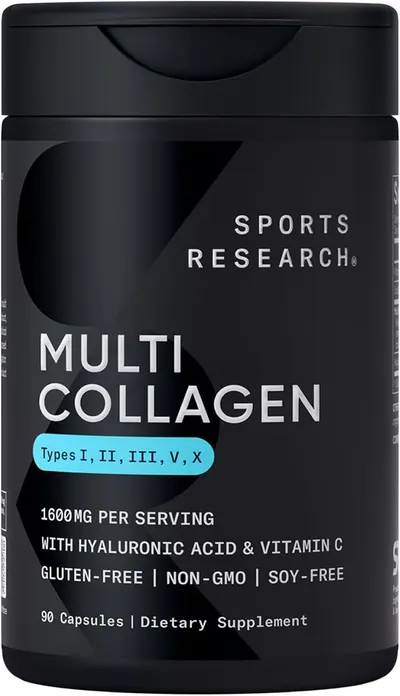 Sports Research® Multi Collagen Peptides w/Hyaluronic Acid8 gallery images · #4,850 in Health & Household
Health & Household brands using infographic A+ modules
- Garden of Life77
- natural elements36
- Natures Craft38
- Purely Optimal52
- Vital Proteins57
- Bloom Nutrition32
- Optimum Nutrition70
Health & Household product niches
Our design team makes Amazon listing images, infographics and A+ content. £750 per day, with revisions the next day.
Last example added 2026-10-23 · 255 examples. Image types are tagged by AI and checked by hand in samples.